Section 1.4 Rational Functions

Goals:
  • F: Be able to produce a graph of a given rational function, indicating the vertical asymptotes, and \(x\)- and \(y\)-intercepts, if any.
  • F: Be able to determine the domain and/or range of a function given as an equation or a graph.

Problem 1.4.1.

For this investigation, refer to the graph on Desmos at: http://tinyurl.com/153ratexp There, you will find the rational function \(y=\frac{a(x-b)}{x-d}\text{,}\) with sliders for \(a\text{,}\) \(b\text{,}\) and \(d\text{.}\)
  1. Begin by setting \(a=1\) and \(b=1\text{.}\) Slide the value of \(d\text{.}\)
    1. What happens as \(d\) gets larger?
    2. What happens when \(d=0\text{?}\)
    3. What happens when \(d\) is negative?
    4. If you are only looking at the graph and not the function equation, what about the graph would let you know the value of \(d\text{?}\)
  2. Set \(a=1\) and \(d=0\text{.}\) Slide the value of \(b\text{.}\)
    1. What happens as \(b\) gets larger?
    2. What happens when \(b=0\text{?}\)
    3. What happens when \(b\) is negative?
    4. If you are only looking at the graph and not the function equation, what about the graph would let you know the value of \(b\text{?}\)

Problem 1.4.2.

Graph \(r(x)=\frac{x}{x+2}\) on the domain of all real numbers. Be sure to label any asymptotes and intercepts.
A coordinate grid showing the x- and y-axes with arrowheads, labeled from -6 to 6 in increments of 1. The origin \((0, 0)\) is at the center. The grid consists of evenly spaced squares, and the axes are bold for clarity.
Figure 1.4.3. Blank coordinate plane
Solution 1.
The solution to ProblemΒ 1.4.2 is outlined below:
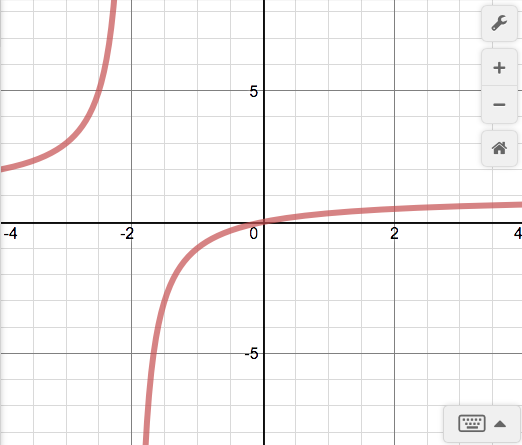
Solution: Step 1: Determine where the function is undefined. In our example, the function is undefined when the denominator is 0. Therefore, by setting \(x+2=0\text{,}\) we get \(x=-2\text{.}\) Therefore, \(x=-2\) will be a vertical asymptote. Vertical asymptotes are values that the function approaches.
Step 2: Graph the function in an appropriate window on Desmos. Set up the window for \(x\) to be \(-4 \leq x \leq 4\text{.}\)
Step 3: Draw your own graph. Refer to FigureΒ 1.4.4, the graph from Desmos. On your own graph, draw a dotted vertical line at \(x=-2\text{,}\) and label the intercept at \((0,0)\text{.}\)
NOTE: In calculus, you will learn that a function can also have horizontal asymptotes. Our example has a horizontal asymptote \(y=1\text{.}\) However, for our purposes, indicating only the vertical asymptotes is enough.
A curve representing a rational function with a vertical asymptote near \(x = -2\) and a horizontal asymptote near \(y = 0\text{.}\) The graph decreases steeply toward negative infinity as x approaches -2 from the right and rises toward positive infinity as x approaches -2 from the left. For large positive x-values, the curve approaches the x-axis. The visible grid shows x-values from about -4 to 4 and y-values from about -6 to 6.
Figure 1.4.4. Graph of a rational function with vertical and horizontal asymptotes.

Problem 1.4.5.

Graph \(g(x)=\frac{x-1}{x+4}\) on the domain of all real numbers. Be sure to label any asymptotes and intercepts.
A coordinate grid showing the x-axis labeled from -8 to 7 and the y-axis labeled from -6 to 6 in increments of 1. The origin \((0, 0)\) is at the center. Both axes have arrowheads, and the grid consists of evenly spaced squares for plotting points or graphs.
Figure 1.4.6. Blank coordinate plane with labeled axes and grid lines.

Problem 1.4.7.

Graph \(P(x)=\frac{x(x-3)}{(x+2)(x-4)}\) on the domain of all real numbers. Be sure to label any asymptotes and intercepts.
A coordinate grid showing the x-axis labeled from -11 to 11 and the y-axis labeled from -6 to 6 in increments of 1. The origin \((0, 0)\) is at the center. Both axes have arrowheads, and the grid consists of evenly spaced squares suitable for plotting points or graphs.
Figure 1.4.8. Blank coordinate plane with labeled axes and grid lines.
Solution 2.
The solution to Example ProblemΒ 1.4.7 is outlined below:
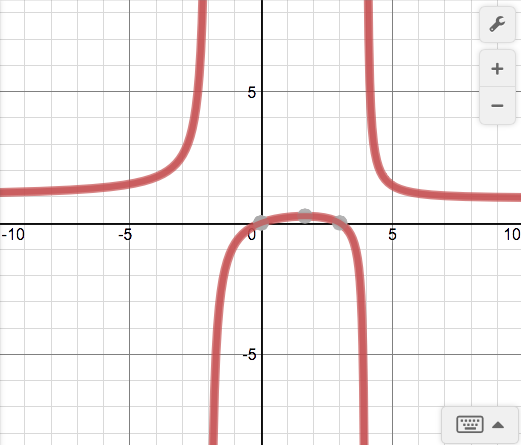
Solution: Step 1: Determine where the function is undefined. In our example, the function is undefined when the denominator is 0. Therefore, by setting \((x+2)(x-4)=0\text{,}\) we get \(x=-2\) or \(x=4\text{.}\) Therefore, \(x=-2\) and \(x=4\) will be vertical asymptotes.
Step 2: Graph the function in an appropriate window on Desmos. Set up the window for \(x\) to be \(-10 \leq x \leq 10\text{.}\)
Step 3: Draw your own graph. Refer to the FigureΒ 1.4.9, the graph from Desmos. On your own graph, draw dotted vertical lines at \(x=-2\) and \(x=4\text{,}\) and label the intercepts at \((0,0)\) and \((3,0)\text{.}\)
A curve representing a rational function with two vertical asymptotes near \(x = -4\) and \(x = 4\text{.}\) The graph rises steeply toward positive infinity as x approaches each asymptote from one side and falls toward negative infinity from the other. Between the asymptotes, the curve dips below the x-axis and then rises slightly, forming a local maximum near the origin. The visible grid shows x-values from about -10 to 10 and y-values from about -6 to 6.
Figure 1.4.9. Graph of a rational function with multiple vertical asymptotes.

Problem 1.4.10.

Graph \(Q(x)=\frac{2x^2+4x-6}{x^2-2x-35}\) on the domain of all real numbers. Be sure to label any asymptotes and intercepts.
A coordinate grid showing the x-axis labeled from -11 to 11 and the y-axis labeled from -6 to 6 in increments of 1. The origin \((0, 0)\) is at the center. Both axes have arrowheads, and the grid consists of evenly spaced squares suitable for plotting points or graphs.
Figure 1.4.11. Blank coordinate plane with labeled axes and grid lines.