Subsection 1.2 Function Transformations Exercises

  1. Cell phones begin to lose (resale) value immediately after purchase. After one year, an iPhone can be resold at 63% of its list price. Assume that each year after that, the resale value continues to drop to 63% of the resale price from the previous year.
    1. Assuming the list price of an iPhone is $649, write an exponential model for the resale price, \(P(t)\text{,}\) of an iPhone \(t\) months after purchase.
    2. According to your model, what is the resale value of the iPhone after 18 months?
    3. According to your model, when is the resale value of the iPhone $150?
    4. Assume that a particular Android phone has a value, \(A(t)\text{,}\) that is always $100 less than the iPhone. Write \(A(t)\) as a composition of \(P(t)\) and another function, \(h(t)\text{,}\) so that \(A(t)=h(P(t))\text{.}\)
    5. Another smartphone has a value, \(V(t)\text{,}\) that is always one half of the value of the iPhone. Write \(V(t)\) as a transformation of \(P(t)\text{.}\)
  2. Refer to the function \(p(x)=x^2\text{.}\)
    1. Suppose \(r(x)= p(x+2)-3\text{.}\) Describe how \(p(x)\) is transformed to create \(r(x)\text{.}\) Verify your description by graphing using Desmos.
    2. Suppose \(q(x)= -p(x-2)+5\text{.}\) Describe how \(p(x)\) is transformed to create \(q(x)\text{.}\) Verify your description by graphing using Desmos.
    3. Suppose \(u(x)\) is created by shifting \(p(x)\) 3 units to the right and 4 units down. Write \(u(x)\) in terms of \(p(x)\text{,}\) and then find an algebraic expression for \(u(x)\text{.}\)
    4. Suppose \(v(x)\) is created by compressing \(p(x)\) vertically by a factor of 5, and shifting 4 units up. Write \(v(x)\) in terms of \(p(x)\text{,}\) and then find an algebraic expression for \(v(x)\text{.}\)
  3. Refer to the functions \(f(x)=2^x\) and \(g(x)=3\cdot 2^x-7\text{.}\)
    1. Describe \(g(x)\) as a transformation of \(f(x)\text{.}\)
    2. Find a function \(h(x)\) so that \(g(x)=h(f(x))\text{.}\)
  4. Consider the functions \(k(x)=8^x\) and \(m(x)=4\cdot 2^x\text{.}\)
    1. Are \(k(x)\) and \(m(x)\) the same function? Explain.
    2. Write \(m(x)\) as a composition of \(f(x)=2^x\) and another function \(b(x)\text{,}\) so that \(m(x)=b(f(x))\text{.}\)
    3. Write \(k(x)\) as a composition of \(f(x)=2^x\) and another function \(d(x)\text{,}\) so that \(k(x)=d(f(x))\text{.}\)
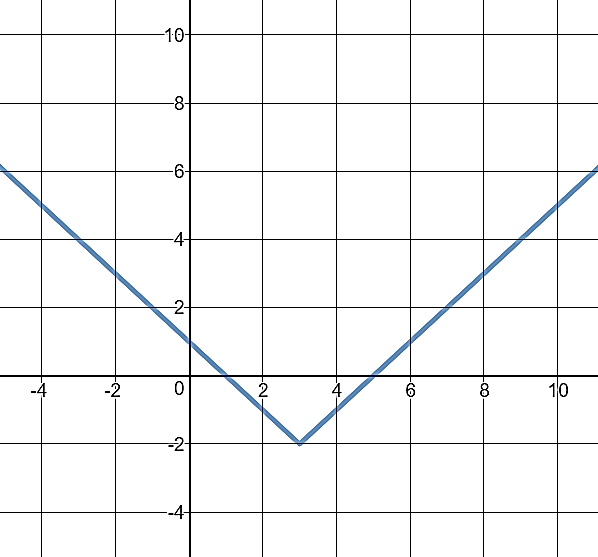
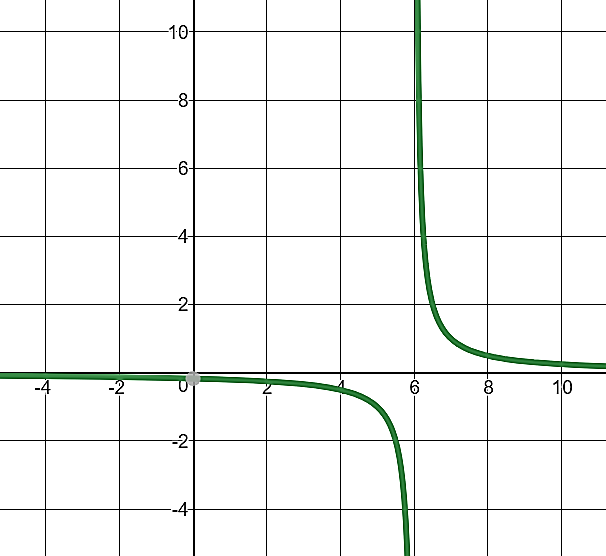
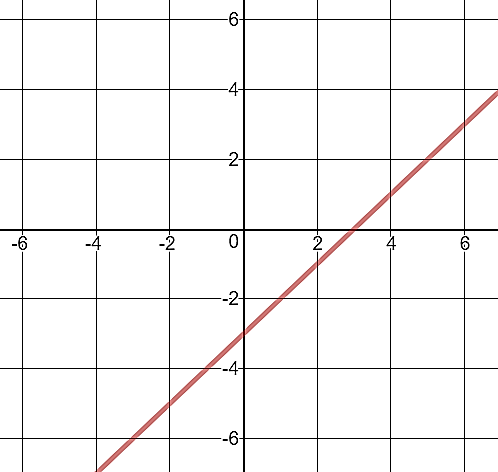
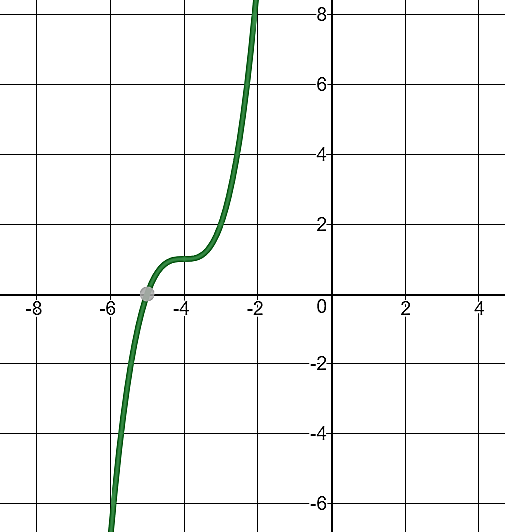
  5. For each graph given, (i) identify the function family (linear, quadratic, exponential, linear absolute value, reciprocal, square root, cubic), (ii) identify how the basic function has been transformed to produce the graph given, and (iii) write an equation of the graph.
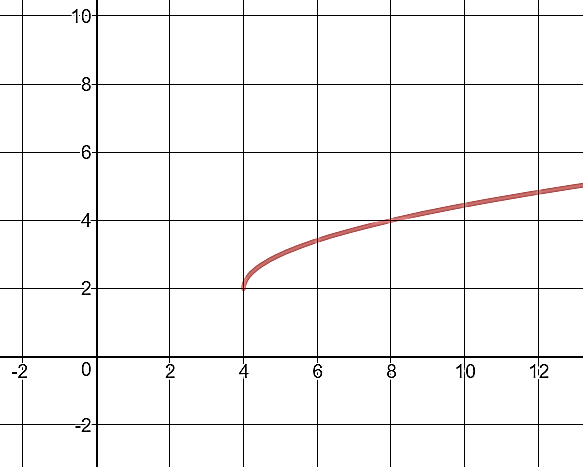
    1. A curve representing the function \(y = \sqrt(x - 4) + 2\text{.}\) The graph starts at the point (4, 2) and increases slowly as x moves to the right, passing through \((8,4)\text{.}\) The horizontal axis ranges approximately from -2 to 14, and the vertical axis ranges from -2 to 10.
      Figure 1.2.22.
    2. A V-shaped graph representing the function \(y = |x - 3| - 2\text{.}\) The vertex is at (3, -2), with one ray extending upward to the right and the other upward to the left. The horizontal axis ranges approximately from -5 to 12, and the vertical axis from -4 to 10.
      Figure 1.2.23.
    3. A graph representing the function \(y = \dfrac{1}{x - 6}\text{.}\) The curve approaches a vertical asymptote at \(x = 6\) and a horizontal asymptote at \(y = 0\text{.}\) The graph decreases toward negative infinity as x approaches 6 from the left and increases toward positive infinity as x approaches 6 from the right. The axes range approximately from -5 to 12 horizontally and -4 to 12 vertically.
      Figure 1.2.24.
    4. A straight line with positive slope plotted on a coordinate grid. The line passes through points approximately \((2, -1)\text{,}\) \((4, 1)\text{,}\) and \((6, 3)\text{,}\) crossing the right half of the plane and trending upward. Axis markings shown from about -6 to 6 vertically and -6 to 7 horizontally.
      Figure 1.2.25.
    5. A curve representing the function \(y = (x + 5)^3\) with an inflection point at \((-4, 1)\text{.}\) The graph decreases steeply for x less than -6, flattens near the inflection point, and then rises sharply for x greater than -3. The horizontal axis ranges approximately from -8 to 4, and the vertical axis from -6 to 8.
      Figure 1.2.26.
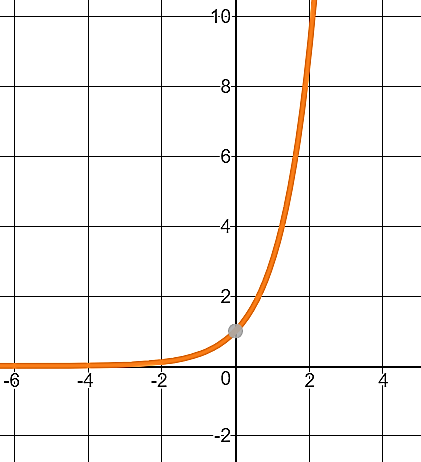
    6. A curve representing the function \(y = e^x\) or similar exponential growth. The graph passes through \((0, 1) \) and rises steeply for positive x-values. The horizontal axis ranges approximately from -6 to 4, and the vertical axis from -2 to 10. The curve approaches the x-axis for large negative x-values and increases rapidly for x greater than 1.
      Figure 1.2.27.
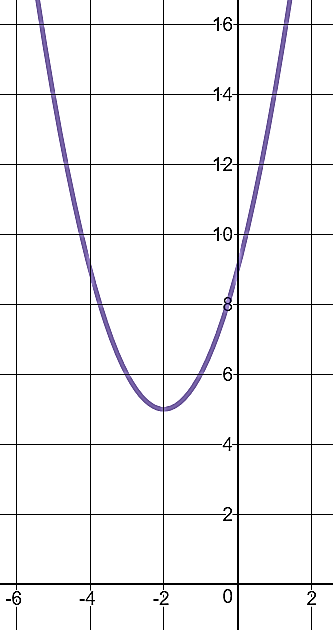
    7. A parabola opening upward with its vertex at \((-2, 5)\text{.}\) The curve passes \((0, 9)\) on the y-axis, indicating a vertical shift above the origin. The visible window shows x-values approximately from -6 to 2 and y-values from 0 to 16.
      Figure 1.2.28.
  6. Consider the functions \(F(x)=\ln x\text{,}\) \(G(x)=\ln (x-2)\text{,}\) \(H(x)=\ln x - 2\text{,}\) and \(J(x)=\ln (x+2)\text{.}\) Describe \(G(x)\text{,}\) \(H(x)\text{,}\) and \(J(x)\) as transformations of \(F(x)\text{.}\) Do any of these functions have the exact same graph?
  7. Refer to \(f\) in TableΒ 1.2.29.
    Table 1.2.29. \(f(x)\)
    \(x\) 0 1 2 3
    \(f(x)\) 3 0 2 -4
    1. What are the domain and range of \(f\text{?}\)
    2. Find a function table for the inverse function, \(f^{-1}\text{.}\)
    3. What are the domain and range of \(f^{-1}\text{?}\)
  8. Allie is at the beach, and is hungry for a hot dog. Currently, she is standing 60 meters west of the boardwalk. Directly in front of her on the boardwalk, the nearest food vendor is her friend Carmen, who sells pizza. The hot dog vendor is 40 meters south of Carmen’s pizza stand. Allie plans to walk directly to the hot dog vendor.
    1. Draw a diagram showing Allie’s path and impose coordinates on the diagram.
    2. Write an equation for the line that describes the Allie’s path.
    3. Write parametric equations to describe Allie’s position at time \(t\) seconds, if it takes her 40 seconds to walk from her initial position to the hot dog vendor.
  9. The population of India by year is given in TableΒ 1.2.30.
    Table 1.2.30. Population of India by year (Source: data.worldbank.org)
    Year 2000 2003 2006 2009 2012
    Pop. (millions) 1053.5 1108.4 1162.1 1214.2 1263.6
    1. Use the population in 2000 and 2012 to build an exponential model, \(P(t)\text{,}\) for the number of millions of people in India, with \(t=0\) corresponding to the year 2000.
    2. Plot \(P(t)\) and the data in TableΒ 1.2.30 in Desmos. Discuss how well the model fits the data.
    3. Use \(P(t)\) to predict the population of India in 2014. Compare the result of the model with the actual population in 2014, which was 1295.3 million.
    4. Based on your model, when will the population of India reach 1400 million?