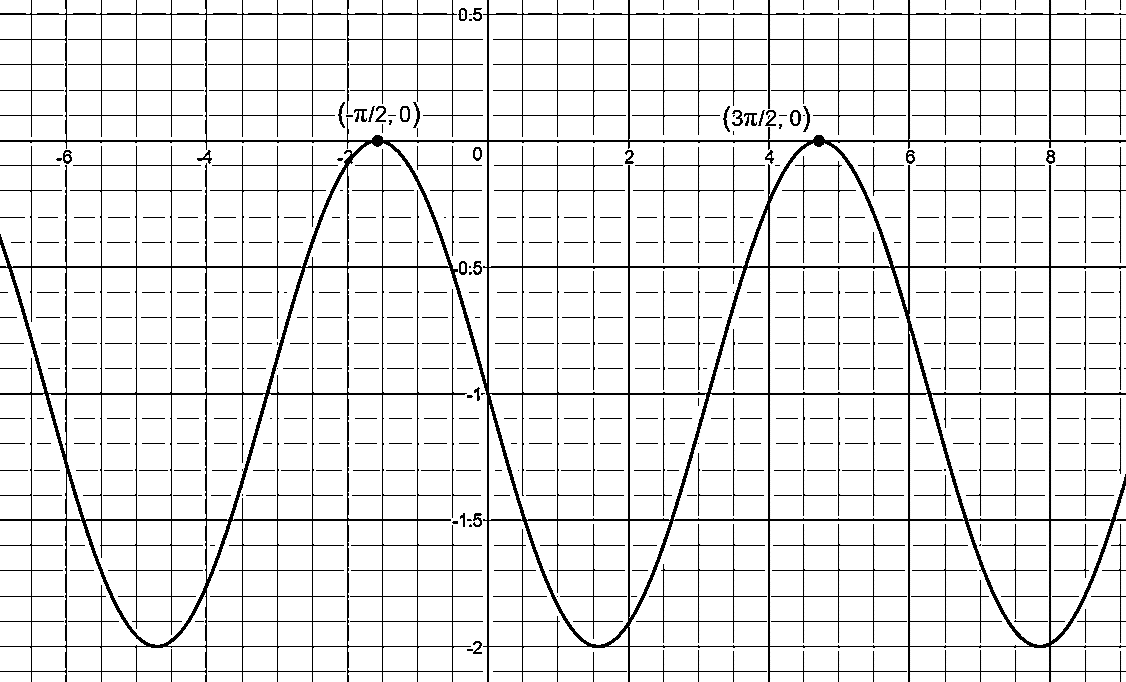
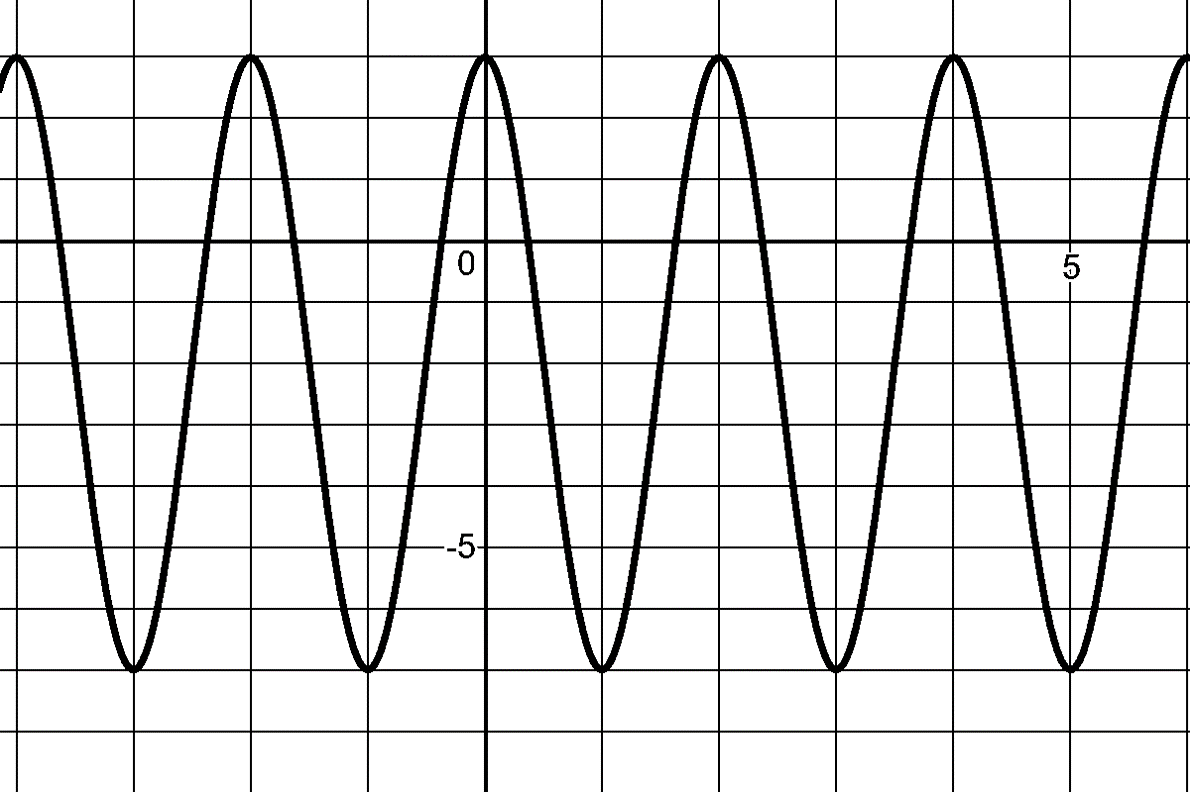
In Desmos, at: https://www.desmos.com/calculator/lujykscfnv, you will find the following graphs: orange) \(y=a\sin(b(x-c))+d\text{,}\) and purple) \(y=a\cos(b(x-c))+d\text{.}\) You should have sliders for \(a\text{,}\)\(b\text{,}\)\(c\text{,}\) and \(d\text{.}\) To begin, set \(a=1\text{,}\)\(b=1\text{,}\)\(c=0\text{,}\) and \(d=0\text{.}\)
Let \(a=5\text{.}\) How has the cosine changed compared to when \(a=1\text{?}\) What specific part of the graph measures 5 units? This is called the amplitude. Include a sketch that shows the amplitude.
Set \(b=1\text{.}\) On the cosine function, what is the interval starting from \(x=0\) in order for the graph to make one complete cycle and return to its original starting position? (This is the period.)
You cannot directly see \(b\) on the cosine wave. Instead, \(b\) affects the period. If you know \(b\text{,}\) how can you determine the period of the cosine wave? In reverse, if you know the cosine wave period, how can you find \(b\text{?}\)
Slide the value of \(d\text{.}\) How does the cosine wave change? The line \(y=d\) is called the midline of the cosine wave. Explain why this name is used.
Understanding the sine graph.The constants \(a\text{,}\)\(b\text{,}\)\(c\text{,}\) and \(d\) operate in the same way in the sine function, \(f(x)=a \sin(b(x-c)) + d\text{,}\) but you begin with the base function \(f(x)= \sin(x)\text{.}\)
Predict what each of the following graphs will look like and sketch. Use Desmos to check your answer. Be sure to label the amplitude, period, midline and endpoints.
Predict what each of the following graphs will look like and sketch. Use Desmos to check your answer. Be sure to label the amplitude, period, midline and endpoints.