Skip to main content
Contents Dark Mode Prev Up Next \(
\newcommand{\lt}{<}
\newcommand{\gt}{>}
\newcommand{\amp}{&}
\definecolor{fillinmathshade}{gray}{0.9}
\newcommand{\fillinmath}[1]{\mathchoice{\colorbox{fillinmathshade}{$\displaystyle \phantom{\,#1\,}$}}{\colorbox{fillinmathshade}{$\textstyle \phantom{\,#1\,}$}}{\colorbox{fillinmathshade}{$\scriptstyle \phantom{\,#1\,}$}}{\colorbox{fillinmathshade}{$\scriptscriptstyle\phantom{\,#1\,}$}}}
\)
Section 1.1 Families of Functions
F: Be able to identify and sketch graphs of basic functions, and identify important features of these functions.
Families of functions are groups of functions that have common graphical and algebraic characteristics. Here, we will explore several families of functions and determine which characteristics are common to all functions in a given family.
Definition 1.1.1 .
A function is
even if and only if
\(f(-x)=f(x)\) for all
\(x\) in the domain of
\(f\text{.}\) A function is
odd if and only if
\(f(-x)=-f(x)\) for all
\(x\) in the domain of
\(f\text{.}\)
Problem 1.1.2 .
For each function, decide if the function is even, odd or neither even nor odd.
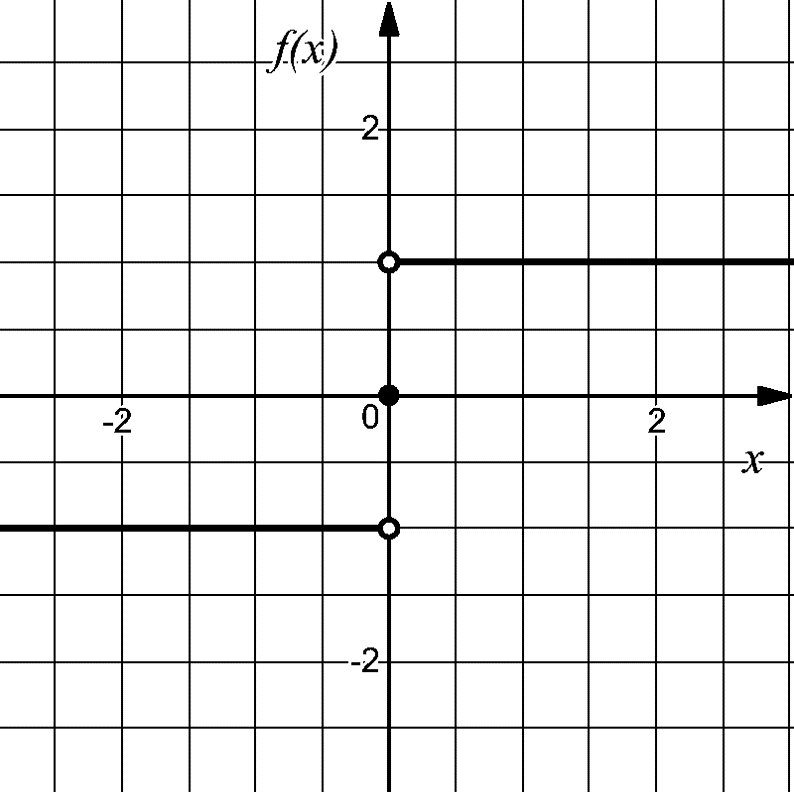
The graph of
\(f(x)\) shown in
Figure 1.1.3 below.
Figure 1.1.3. Graph of \(f(x)\text{.}\)
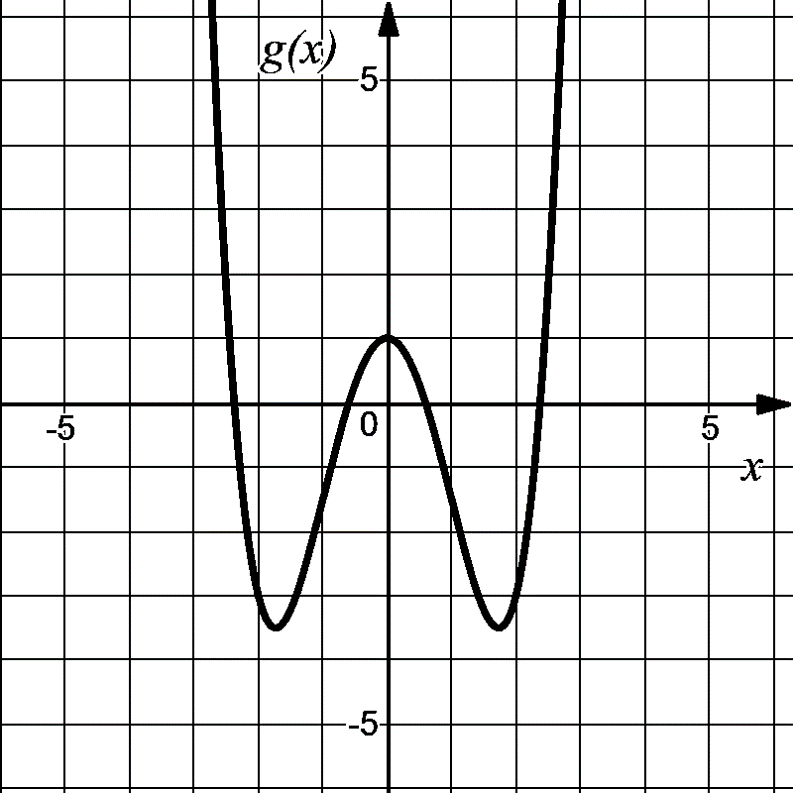
The graph of
\(g(x)\) shown in
Figure 1.1.4 below.
Figure 1.1.4. Graph of \(g(x)\text{.}\)
The function
\(k(x)=-2x^2+8x-7\text{.}\)
The function
\(q(x)=x^3-x\text{.}\)
Complete all the information for each function below.
Figure 1.1.5. Blank graph and table for plotting \(f(x)\text{.}\)
Figure 1.1.6. Blank graph and table for plotting \(f(x)\text{.}\)
Figure 1.1.7. Blank graph and table for plotting \(f(x)\text{.}\)
Function:
\(f(x)=\sqrt{x}\)
Figure 1.1.8. Blank graph and table for plotting \(f(x)\text{.}\)
Figure 1.1.9. Blank graph and table for plotting \(f(x)\text{.}\)
Function:
\(f(x)=\sqrt[3]{x}\)
Figure 1.1.10. Blank graph and table for plotting \(f(x)\text{.}\)
Figure 1.1.11. Blank graph and table for plotting \(f(x)\text{.}\)
Function:
\(\displaystyle{f(x)=\frac{1}{x}}\)
Figure 1.1.12. Blank graph and table for plotting \(f(x)\text{.}\)
Figure 1.1.13. Blank graph and table for plotting \(f(x)\text{.}\)
Function:
\(f(x)=\log_2{x}\)
Figure 1.1.14. Blank graph and table for plotting \(f(x)\text{.}\)