Skip to main content
Contents Dark Mode Prev Up Next \(
\newcommand{\lt}{<}
\newcommand{\gt}{>}
\newcommand{\amp}{&}
\definecolor{fillinmathshade}{gray}{0.9}
\newcommand{\fillinmath}[1]{\mathchoice{\colorbox{fillinmathshade}{$\displaystyle \phantom{\,#1\,}$}}{\colorbox{fillinmathshade}{$\textstyle \phantom{\,#1\,}$}}{\colorbox{fillinmathshade}{$\scriptstyle \phantom{\,#1\,}$}}{\colorbox{fillinmathshade}{$\scriptscriptstyle\phantom{\,#1\,}$}}}
\)
Subsection 2.5 Coordinating Period Amplitude and Midline Exercises
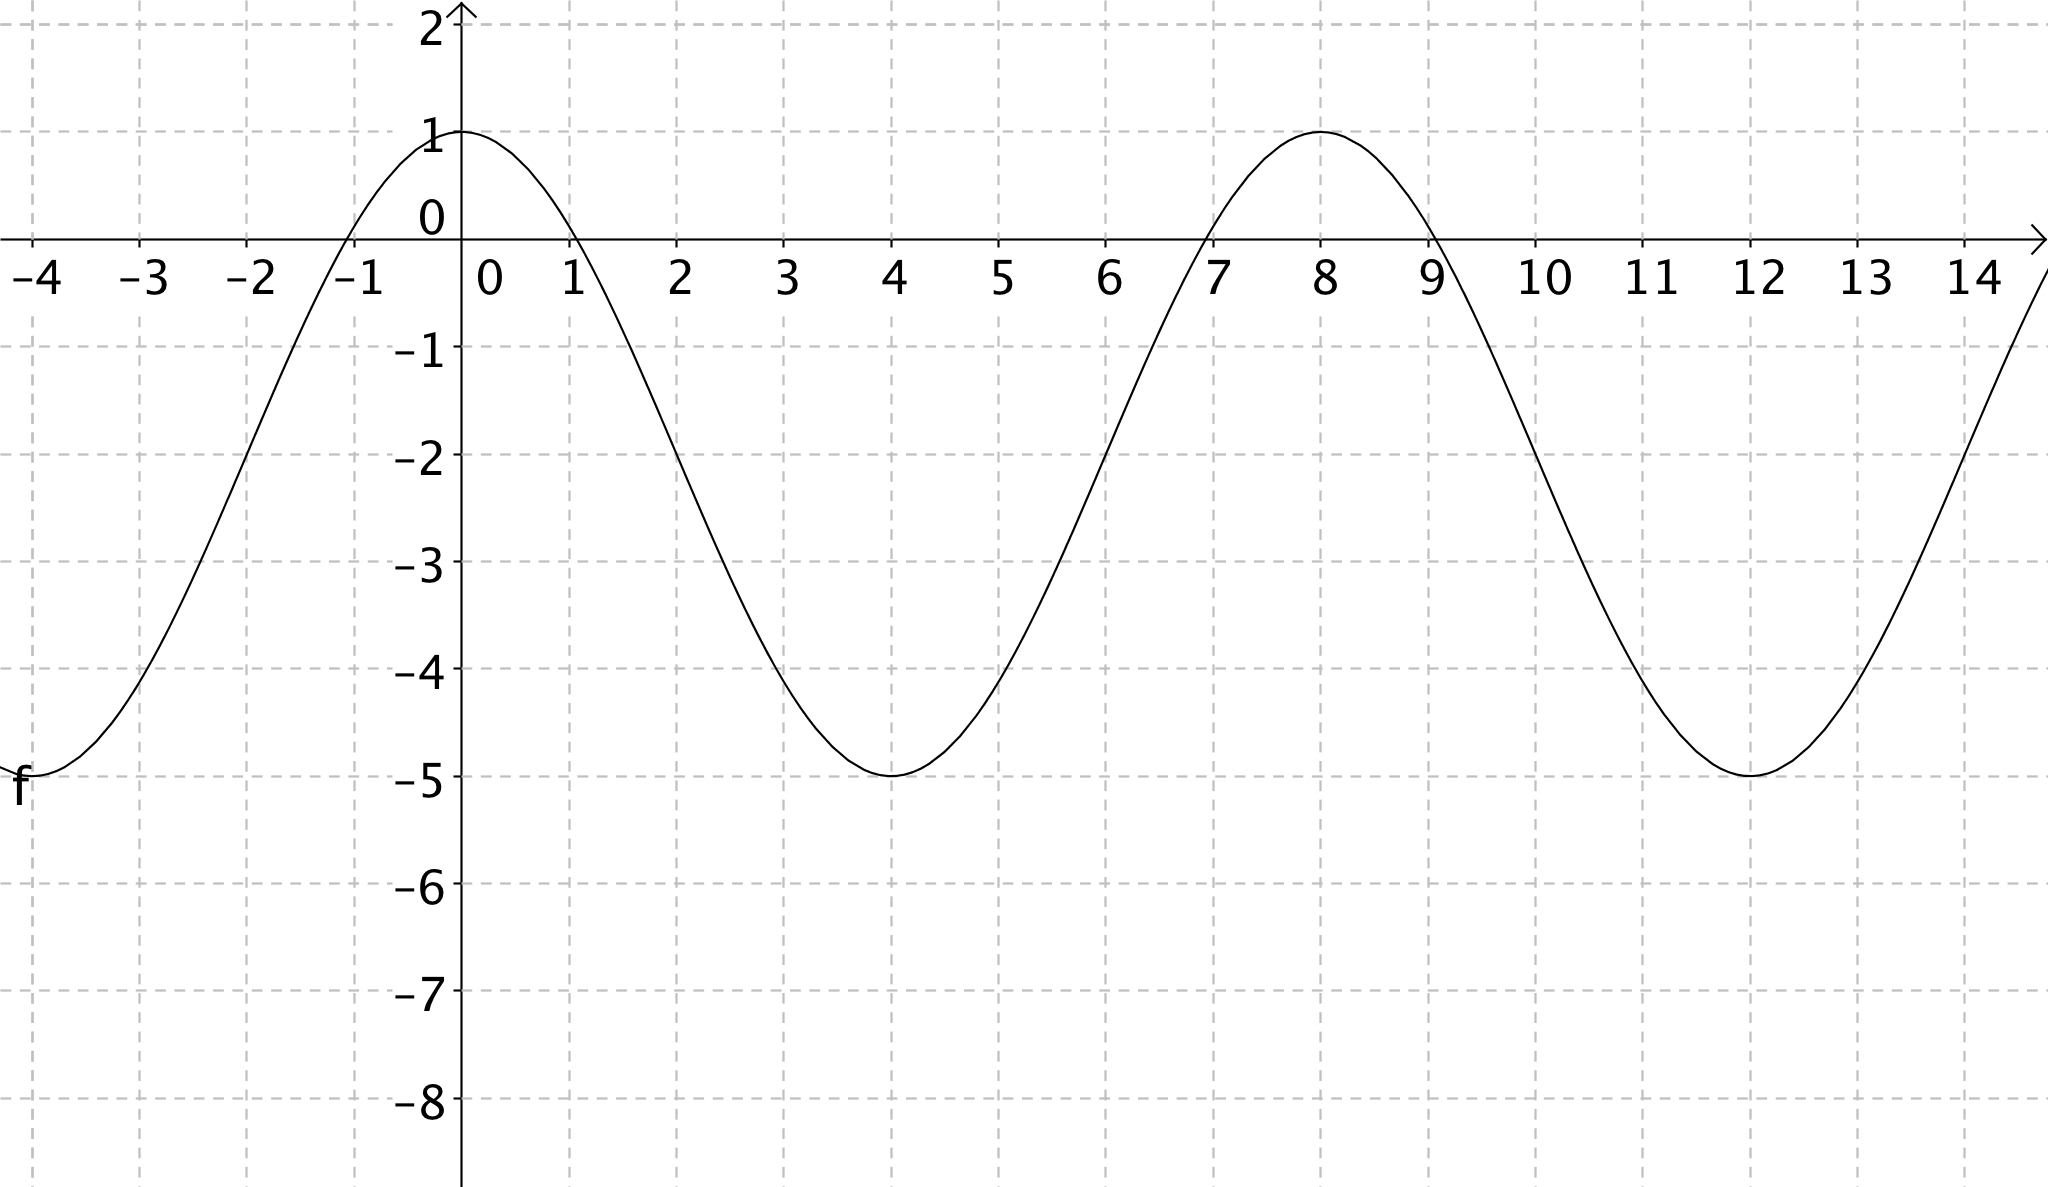
Write a function equation for
\(f\) of the form
\(f(x)=a \sin (b(x-c))+d\text{.}\)
Write a function equation for
\(f\) of the form
\(f(x)=a \cos (b(x-c))+d\text{.}\)
Predict what each of the following graphs will look like and sketch. Use Desmos to check your answer. Be sure to label the amplitude, period, midline and endpoints.
\(y=3\sin (\pi (x-1))-2\) on
\(-4 \leq x \leq 4\)
\(y=\frac{1}{3}\cos (\frac{\pi}{2} (x+1))\) on
\(-8 \leq x \leq 8\)
\(y=\frac{1}{4}\sin(\frac{1}{2}(x-2))-3\) on
\(0 \leq x \leq 26\)
\(y=-5\cos (\frac{1}{\pi} x)+5\) on
\(-10 \leq x \leq 10\)
\(y=4\sin(5\pi x)+2\) on
\(0 \leq x \leq 6\)
\(y=15\cos(\frac{2\pi}{3}(x-\pi))+35\) on
\(-6 \leq x \leq 6\)
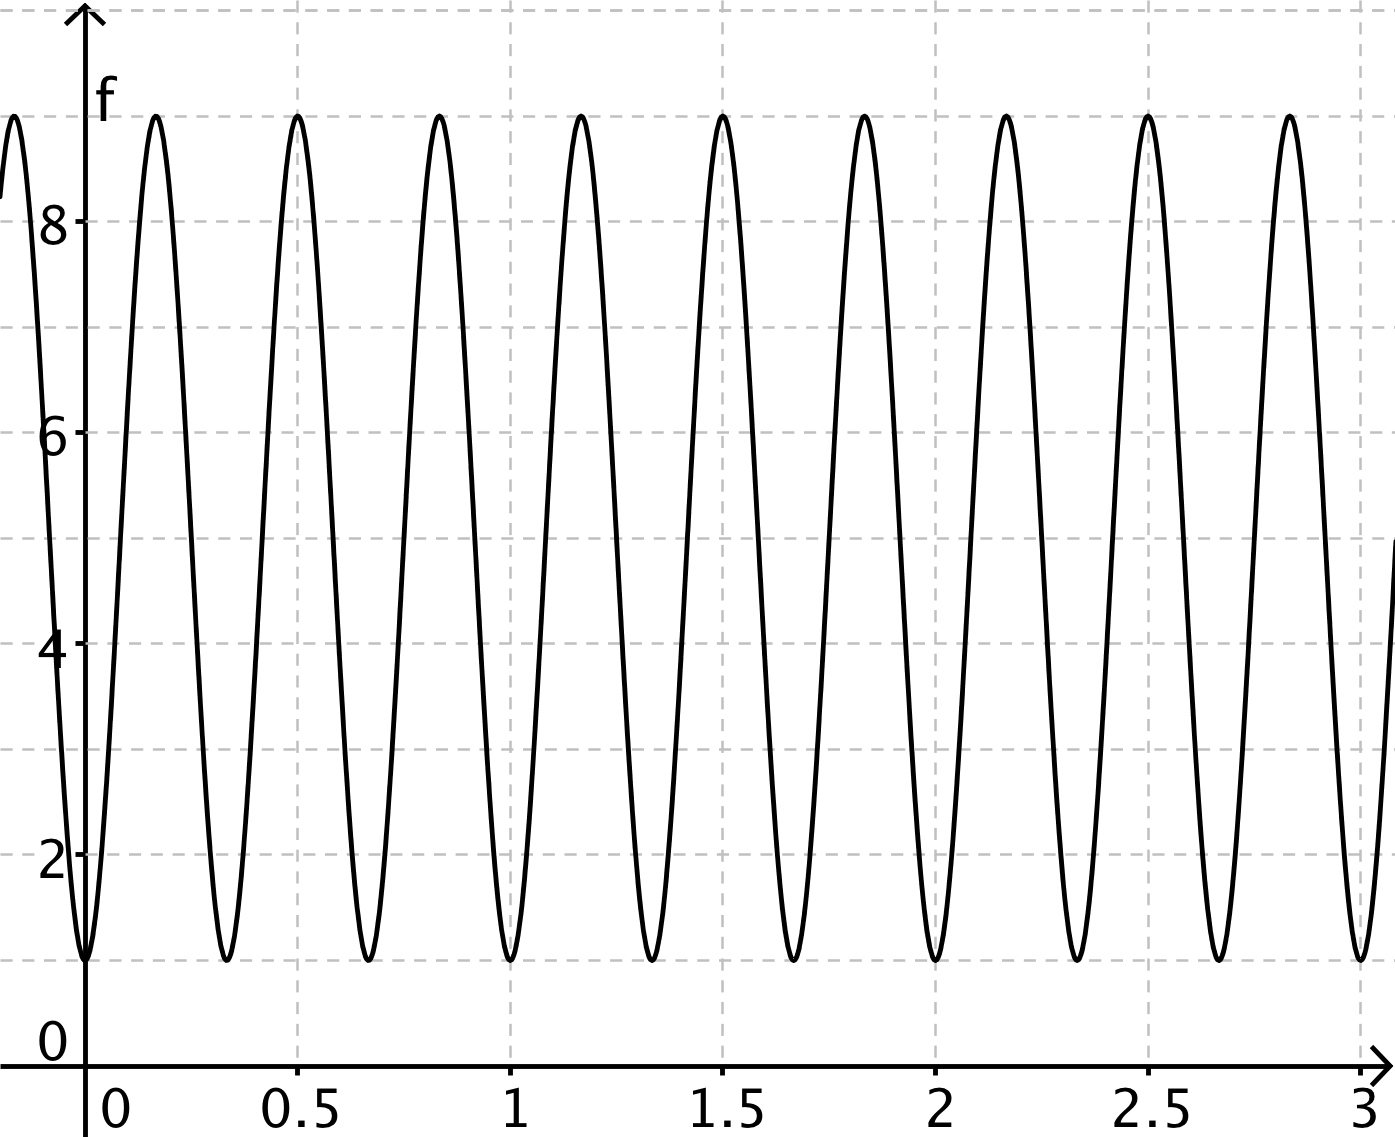
Write a function equation for
\(f\) of the form
\(a \sin (b(x-c))+d\text{.}\)
Write a function equation for
\(f\) of the form
\(a \cos (b(x-c))+d\text{.}\)
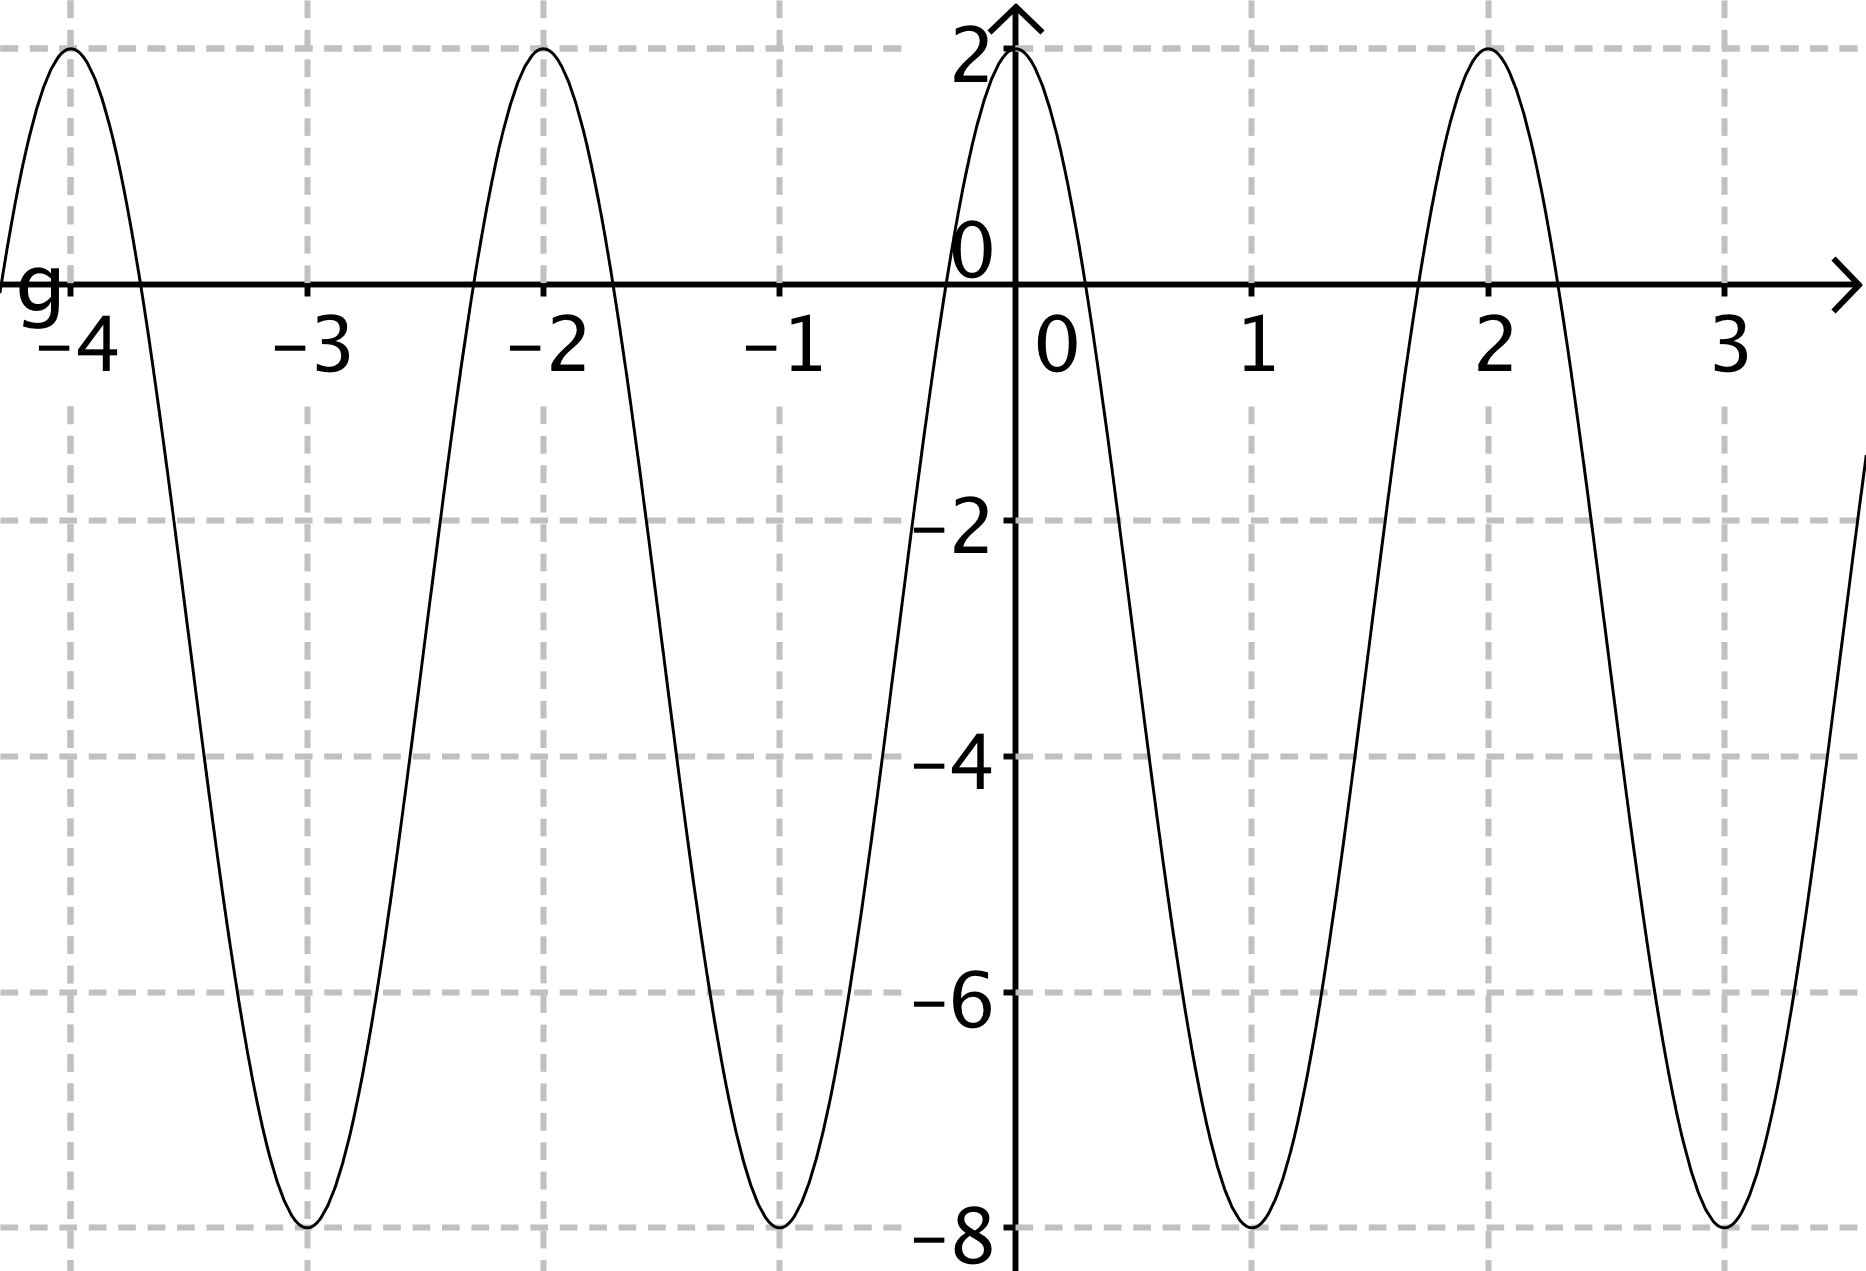
Write a function equation for
\(g\) of the form
\(a \sin (b(x-c))+d\text{.}\)
Write a function equation for
\(g\) of the form
\(a \cos (b(x-c))+d\text{.}\)
The population of Butler has been declining, as seen in
Table 2.5.18 .
Table 2.5.18. Population of Butler
P(t) (people)
89,480
\(80,061\) \(71,633\) \(64,093\) \(57,346\)
Decide what kind of function (linear, quadratic, exponential) is appropriate to model the population of Butler, and explain your reasoning.
Write a function equation for
\(P(t)\text{.}\)
According to your function equation, what was the population of Butler in 2015?
What was the average annual decline in the population of Butler from 1990 to 2010?
When will the population of Butler decline to half of what it was in 1990?
The population of nearby Greenville is described by the equation
\(G(t)=2P(t)\text{.}\) Compare the population of Greenville with the population of Butler.
Write an equation for
\(P^{-1}\text{.}\) State the units of the domain and range of
\(P^{-1}\text{.}\)
Write as a single logarithm.
\(\displaystyle \log_3 y - 4 \log_3 2x\)
\(\displaystyle 2(\ln x-\ln 3y)-(\ln z+2\ln y)\)
\(\displaystyle \log x \cdot \log 2\)
Perform the indicated operation and simplify if possible.
\(\displaystyle \frac{\frac{x+3}{x^2-25}}{\frac{x^2-9}{x+5}}\)
\(\displaystyle \frac{5x+5y}{y-x} \div \frac{15}{3x-3y}\)
\(\displaystyle \frac{t}{t^2-t-30}-\frac{1}{t+5}\)