Skip to main content
Contents Dark Mode Prev Up Next \(
\newcommand{\lt}{<}
\newcommand{\gt}{>}
\newcommand{\amp}{&}
\definecolor{fillinmathshade}{gray}{0.9}
\newcommand{\fillinmath}[1]{\mathchoice{\colorbox{fillinmathshade}{$\displaystyle \phantom{\,#1\,}$}}{\colorbox{fillinmathshade}{$\textstyle \phantom{\,#1\,}$}}{\colorbox{fillinmathshade}{$\scriptstyle \phantom{\,#1\,}$}}{\colorbox{fillinmathshade}{$\scriptscriptstyle\phantom{\,#1\,}$}}}
\)
Section 1.4 Quadratic Functions
In this section we introduce quadratic functions. The graph of a quadratic function is a parabola. In addition to the intercepts, we will be interested in finding the vertex of the parabola, the highest or lowest point on the parabola.
Q: Be able to solve a quadratic equation.
Q: Be able to determine the vertex and equation of a quadratic function given its graph.
F: Be able to give the solution to an inequality or set of inequalities using proper mathematical notation.
F: Be able to determine the domain or range of a function given as an equation or a graph.
Definition 1.4.1 .
Investigation 1.4.1 .
In Desmos, graph
\(f(x)\) and create sliders for
\(a\text{,}\) \(h\) and
\(k\text{.}\) What role do each of these constants play? Include sketches and verbal descriptions to help explain the role of each constant.
Solving Quadratic Equations
Quadratic equations can be solved in several ways: by factoring, by using the quadratic formula, by completing the square or by using a graph. We will first consider solving quadratic equations by factoring, and see how this compares to solving quadratic equations using a graph.
Definition 1.4.3 .
To solve quadratic equations by factoring, we will use the
zero-product property , which says that if
\(ab=0\text{,}\) then
\(a=0\) or
\(b=0\text{.}\)
Problem 1.4.4 .
Solve each equation below by factoring.
\(\displaystyle x^2 - 5x - 6 = 0\)
\(\displaystyle a^2 + 2 = -3a\)
\(\displaystyle r^2 - 16 = 0\)
\(\displaystyle 12x^2 + 8x - 15 = 0\)
\(\displaystyle v^2 = 5v\)
\(\displaystyle -4x^2 - 20x + 24 = 0\)
Some equations can be solved by factoring, even if they are not quadratic equations of the form
\(ax^2+bx+c=0\text{.}\)
Example 1.4.5 .
\(\displaystyle n^4 - 4n^2 + 3 = 0\)
\(\displaystyle 2f^4 = 6f^3 + 8f^2\)
\(\displaystyle 14r^3 + 7r^2 = 7r\)
\(\displaystyle x^4 - 2x^2 + 1 = 0\)
Not every quadratic equation can be solved by factoring. One method of solving any quadratic equation is using the quadratic formula.
Definition 1.4.6 .
The quadratic formula is
\begin{equation*}
x=\frac{-b \pm \sqrt{b^2-4ac}}{2a}
\end{equation*}
where \(a\text{,}\) \(b\text{,}\) and \(c\) are coefficients of the quadratic equation \(ax^2+bx+c=0\text{.}\)
Example 1.4.7 .
Problem 1.4.8 .
Find the
\(x-\) intercepts of each quadratic function. Use Desmos to sketch a graph of the function and label the
\(x-\) intercepts.
\(\displaystyle f(x)=-3x^2-x+3\)
\(\displaystyle g(x)=2x^2-4x+5\)
\(\displaystyle k(x)=4x^2-12x+9\)
From your answers to
Item 1 through
Item 3 above, explain how you can tell if a quadratic equation has no solutions, one solution or two solutions.
Example 1.4.9 .
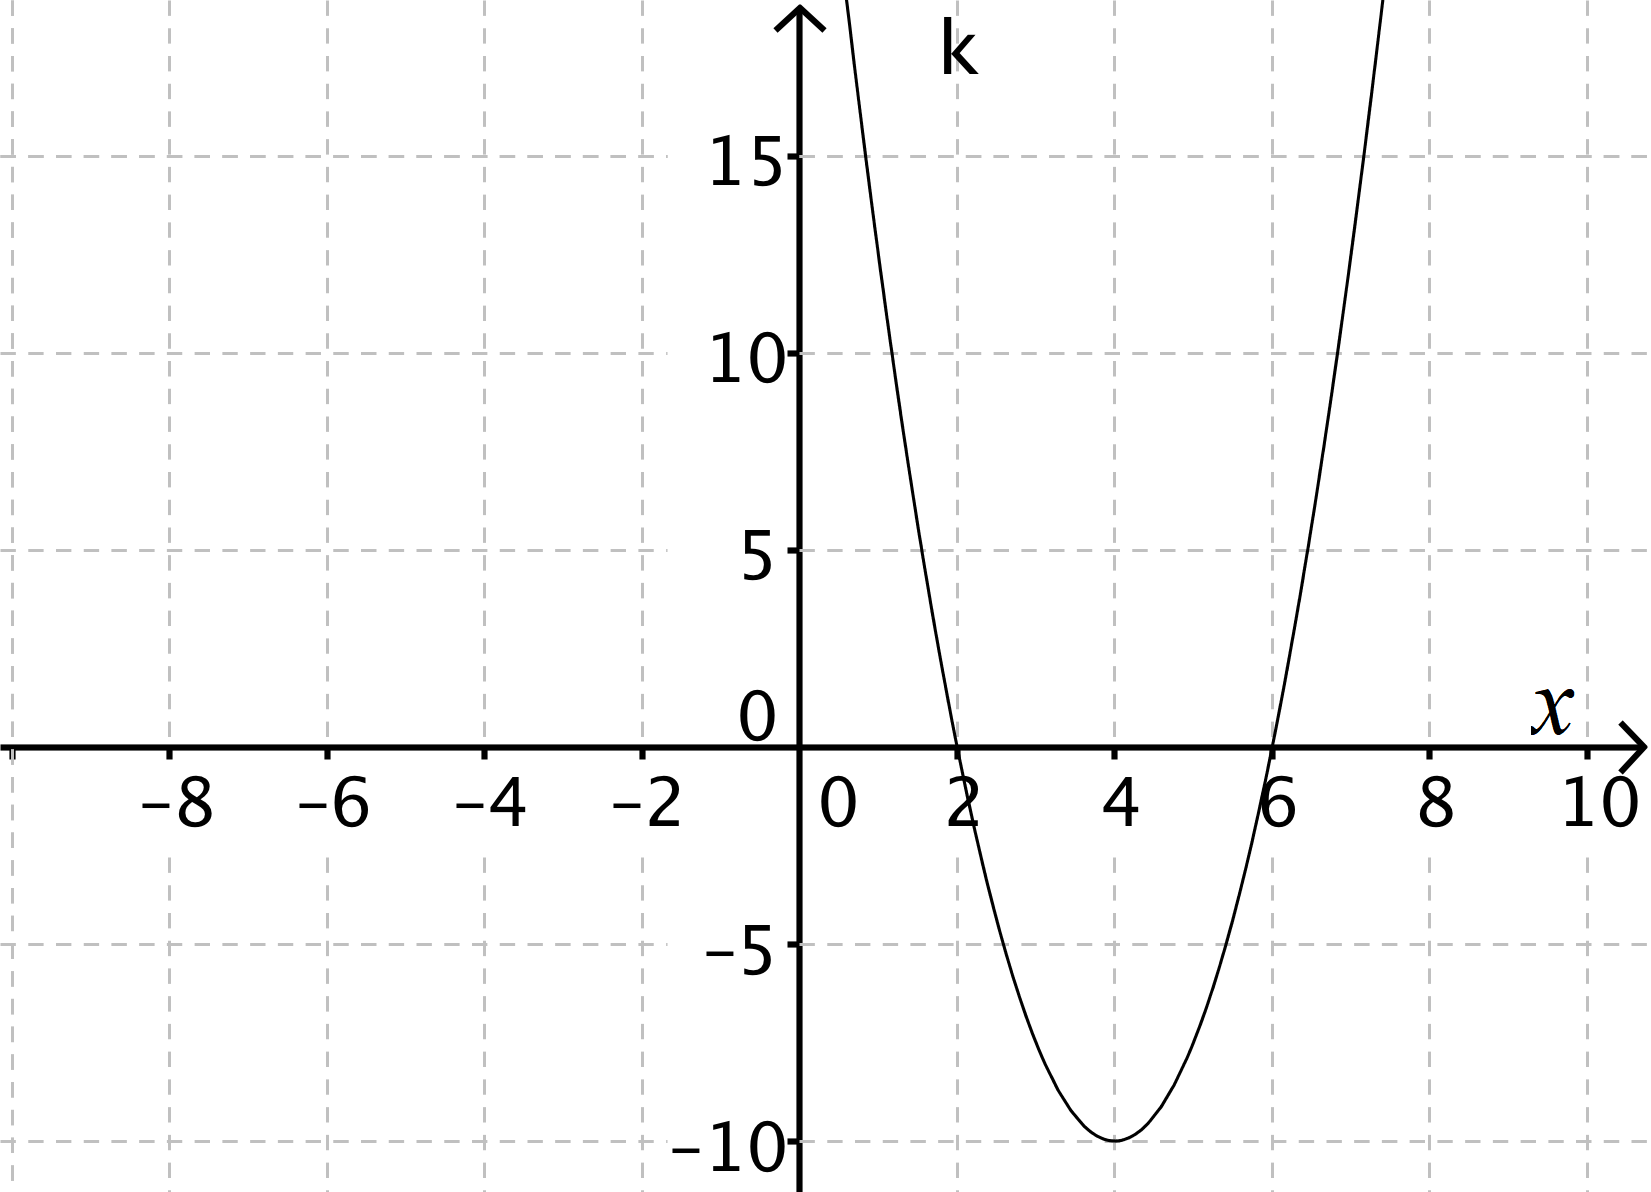
Refer to the graph of
\(k\) in Figure
Figure 1.4.10 .
Figure 1.4.10. Graph of the function k(x).
What are the coordinates of the vertex of the graph of
\(k\text{?}\)
Write a function equation for
\(k(x)\text{.}\)
Solve
\(k(x)=15\) for
\(x\text{.}\)
Solve the inequality
\(k(x) \leq 15\text{.}\)
What is the range of
\(k\) on the domain of all real numbers? What is the range of
\(k\) on the domain
\(0 \leq x \leq 6\text{?}\)
Problem 1.4.11 .
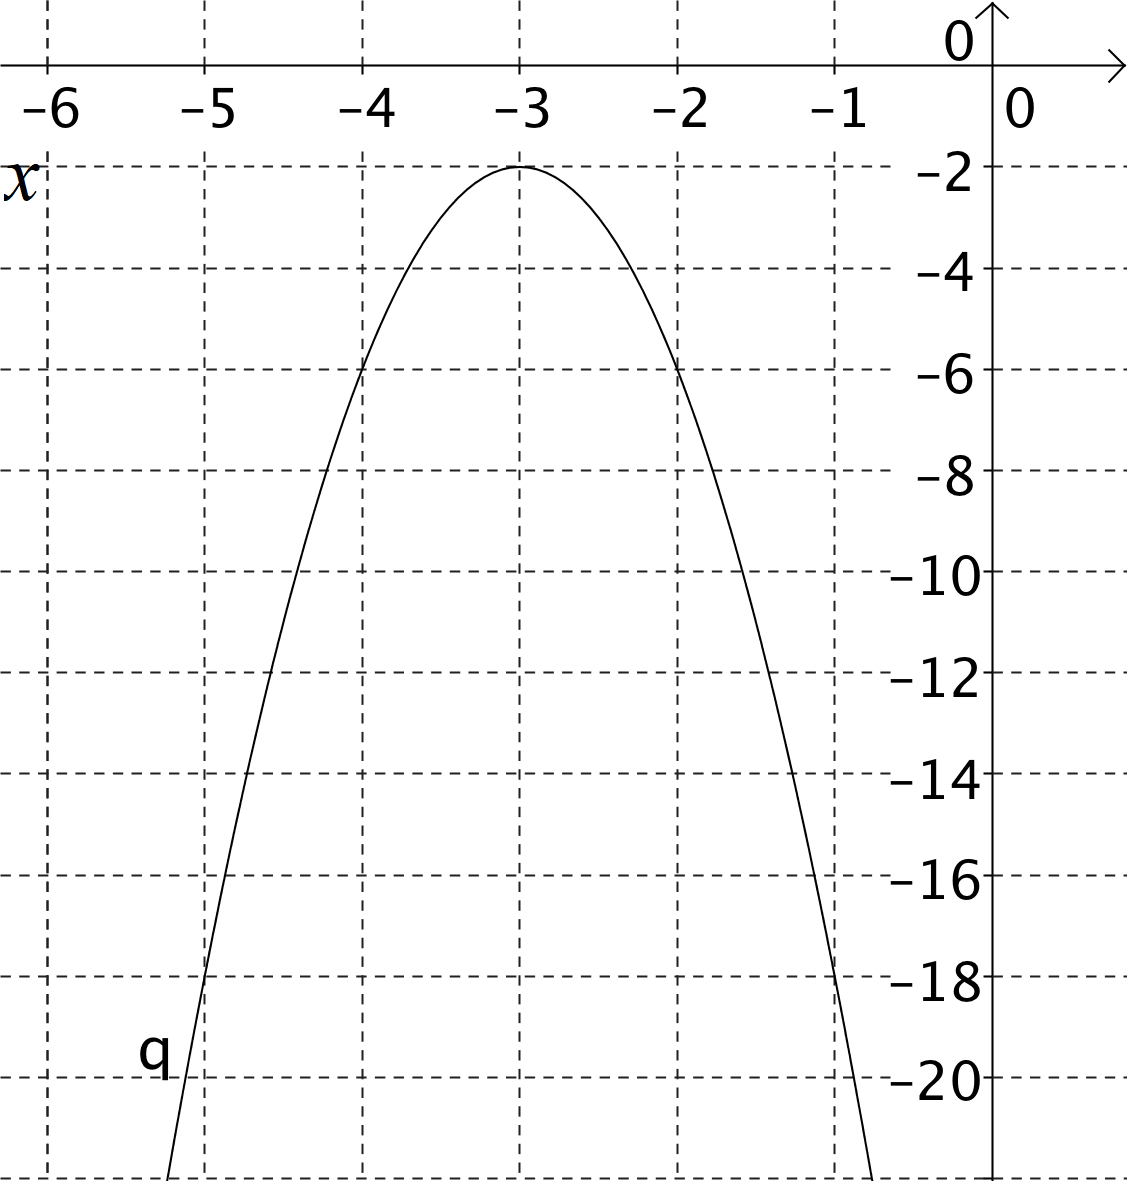
Refer to the graph of
\(q\) in
Figure 1.4.12 .
Figure 1.4.12. Graph of the function q(x).
Evaluate
\(q(-2)\text{.}\)
What are the coordinates of the vertex of
\(q(x)\text{?}\)
Write a function equation for
\(q(x)\text{.}\)
Use your equation from
Item 3 to find
\(q(-5)\text{.}\) Verify the point on your graph.
Solve the inequality
\(q(x) \leq -6\text{.}\)
Solve the inequality
\(q(x) > 2x - 12\text{.}\)
What is the range of
\(q\) on the domain of all real numbers?
Example 1.4.13 .
Find the
\(x-\) and
\(y-\) intercepts of the graph of
\(f\text{.}\)
Find the vertex of the graph of
\(f\text{.}\)
Use
Item 1 and
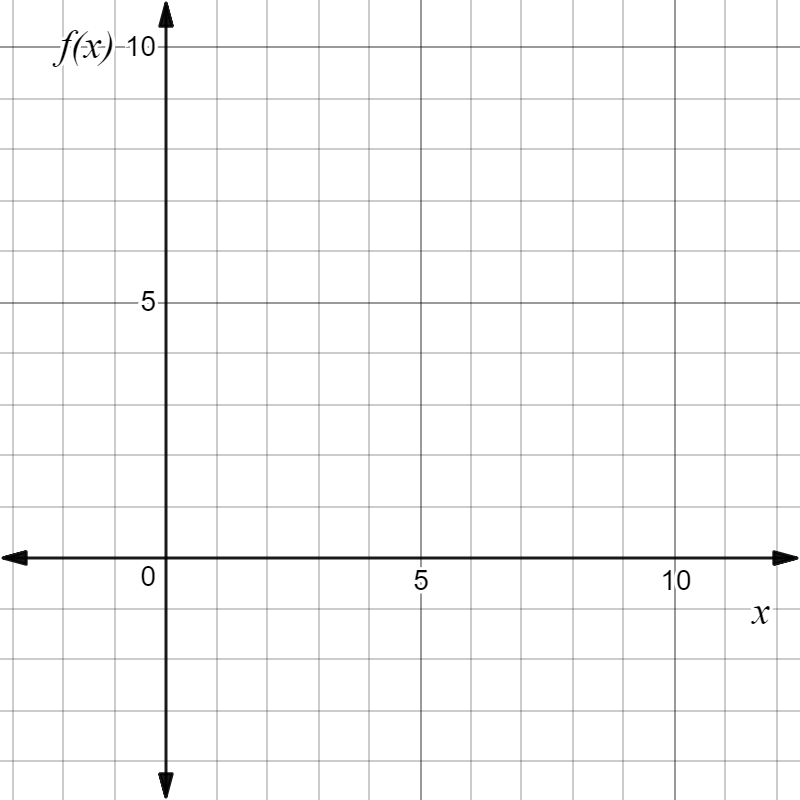
Item 2 to graph
\(f\text{.}\) Use Desmos to check your answer.
Figure 1.4.14. Coordinate axes for the graph of f(x).
Find all the values of
\(x\) where
\(f(x)=3\text{.}\)
Solve
\(f(x) \leq 3\text{.}\)
Solve
\(f(x)=1\) for
\(x\text{.}\) Give your answer as an exact value and a decimal approximation.
Problem 1.4.15 .
Let
\(g(x)=-2x^2+4x+1\text{.}\)
Write
\(g\) in vertex form.
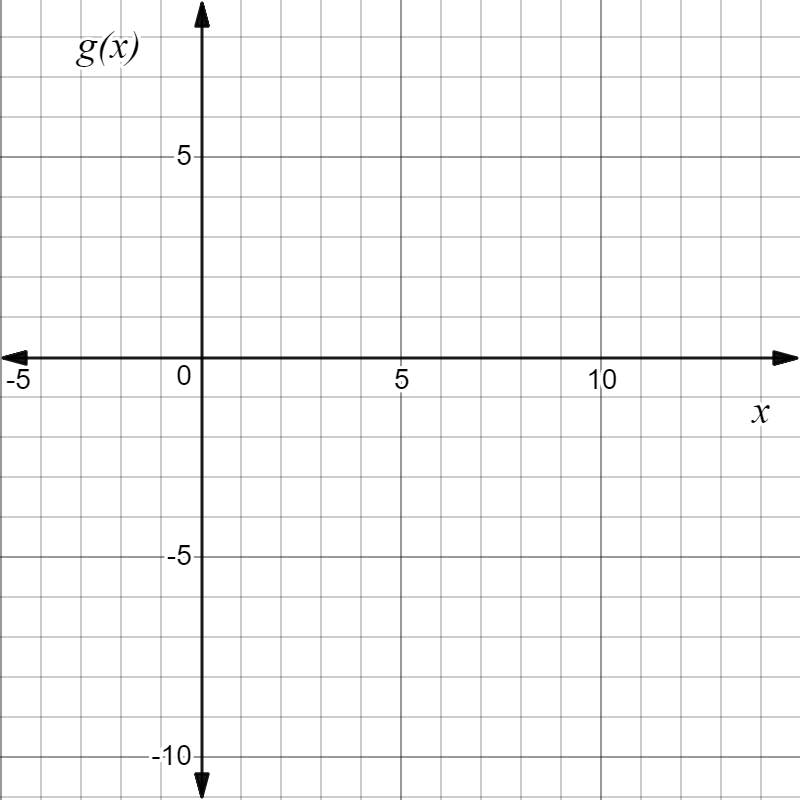
Graph
\(g\) on the axes below.
Figure 1.4.16. Coordinate axes for the graph of g(x).
Solve
\(g(x)=-4\text{.}\)
What is the domain of
\(g\text{?}\) What is the range of
\(g\text{?}\)
What is the maximum value of
\(g\text{?}\) For what value of
\(x\) does this maximum occur?
Problem 1.4.17 .
Refer to the function
\(r(t)=\frac{1}{2}t^2 - \frac{9}{2}t + 4\text{.}\)
Graph
\(r\) on the domain
\(-2 \leq t \leq 14\text{.}\) Be sure to label the vertex and any intercept(s).
What is the range of
\(r\) corresponding to the domain
\(-2 \leq t \leq 14\text{?}\)
What is the range of
\(r\) on the domain of all real numbers?