Skip to main content
Contents Dark Mode Prev Up Next \(
\newcommand{\lt}{<}
\newcommand{\gt}{>}
\newcommand{\amp}{&}
\definecolor{fillinmathshade}{gray}{0.9}
\newcommand{\fillinmath}[1]{\mathchoice{\colorbox{fillinmathshade}{$\displaystyle \phantom{\,#1\,}$}}{\colorbox{fillinmathshade}{$\textstyle \phantom{\,#1\,}$}}{\colorbox{fillinmathshade}{$\scriptstyle \phantom{\,#1\,}$}}{\colorbox{fillinmathshade}{$\scriptscriptstyle\phantom{\,#1\,}$}}}
\)
Subsection 1.4 Quadratic Functions Exercises
Refer to
\(g(t)=t^2 - 8t + 15\text{.}\)
Graph the function
\(g\) on the domain
\(-6 \leq t \leq 6\text{.}\) Be sure to label the vertex and any intercept(s).
Solve the inequality
\(g(t)>3\text{.}\)
Solve the inequality
\(g(t)<t^2-1\text{.}\)
What is the range of
\(g\) on the domain of all real numbers?
\(\displaystyle a^2-100=300\)
\(\displaystyle 2y^2-2y=-5y\)
\(\displaystyle -3x+2=-x^2\)
\(\displaystyle n^4-4n^2=-4\)
\(\displaystyle -4=9x^2+12x\)
\(\displaystyle 5t^2+t-2=0\)
\(\displaystyle \frac{1}{2}w^2+\frac{2}{3}w-\frac{1}{3}=0\)
\(\displaystyle (2z+1)^2-3=-2(2z+1)\)
\(\displaystyle 5x^2-3x=-2x^3\)
\(\displaystyle 2b^2-14b+24=0\)
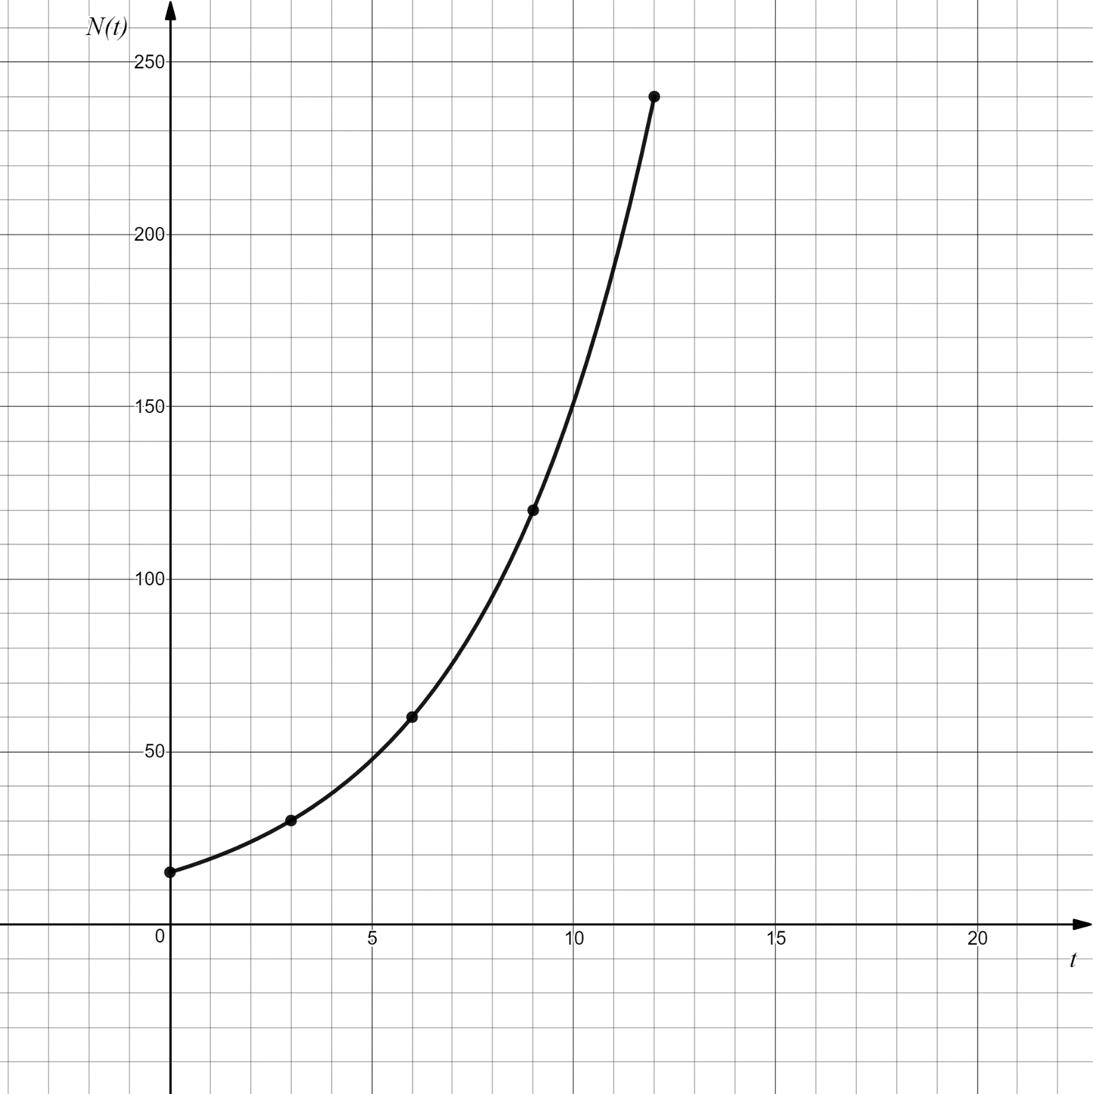
The graph below shows the number of students,
\(N\text{,}\) in Math Club
\(t\) years after 1990, when the club started.
Figure 1.4.18.
How many students were in Math Club in 1999?
When were there approximately 50 students in Math Club?
How many students were in Math Club when it started in 1990?
When will the number of students in Math Club reach four times the number in 1990?
How is the number of students joining Math Club changing over time?
Let
\(g(x)=3x^2+2x-1\text{.}\)
Find the
\(x-\) and vertical intercepts of the graph of
\(g\text{.}\)
Find the vertex of the graph of
\(g\text{.}\)
Use
Item 4.a and
Item 4.b to graph
\(g\text{.}\) Use Desmos to check your answer.
Solve algebraically:
\(g(x)=7\text{.}\) Use Desmos to check your answer.
Solve algebraically:
\(g(x)=5\text{.}\) Use Desmos to check your answer.
Solve
\(g(x) > -1\text{.}\)
According to the U.S. Library of Congress(
https://www.loc.gov/rr/scitech/mysteries/cricket.html ), you can estimate the temperature by listening to the chirping of a cricket. At 70 F a cricket will chirp 113 times per minute, and at 80 F a cricket will chirp 173 times per minute.
Write a linear function for
\(T(c)\text{,}\) the temperature when a cricket makes
\(c\) chirps per minute.
What is the temperature if a cricket chirps 100 time per minute?
How many times a minute will a cricket chirp if it is 52 F?
In part
Item 5.a you found the slope of the linear function describing the relationship between the number of times a cricket chirps per minute and the temperature. What does this slope represent?
In part
Item 5.a you found the vertical intercept of the linear function describing the relationship between the number of times a cricket chirps per minute and the temperature. What does this vertical intercept represent?
Table 1.4.19 shows a linear pattern. Make a graph of the values in the table. Then, write a function equation that gives the output value corresponding to any input.
Table 1.4.19. Patterns
A basketball court is 94 feet by 50 feet. Lisa takes 20 seconds to walk from one corner of the court to the diagonally opposite corner.
Draw a diagram of the court and Lisa’s path, and impose coordinates on the diagram.
Write parametric equations to describe Lisa’s path.
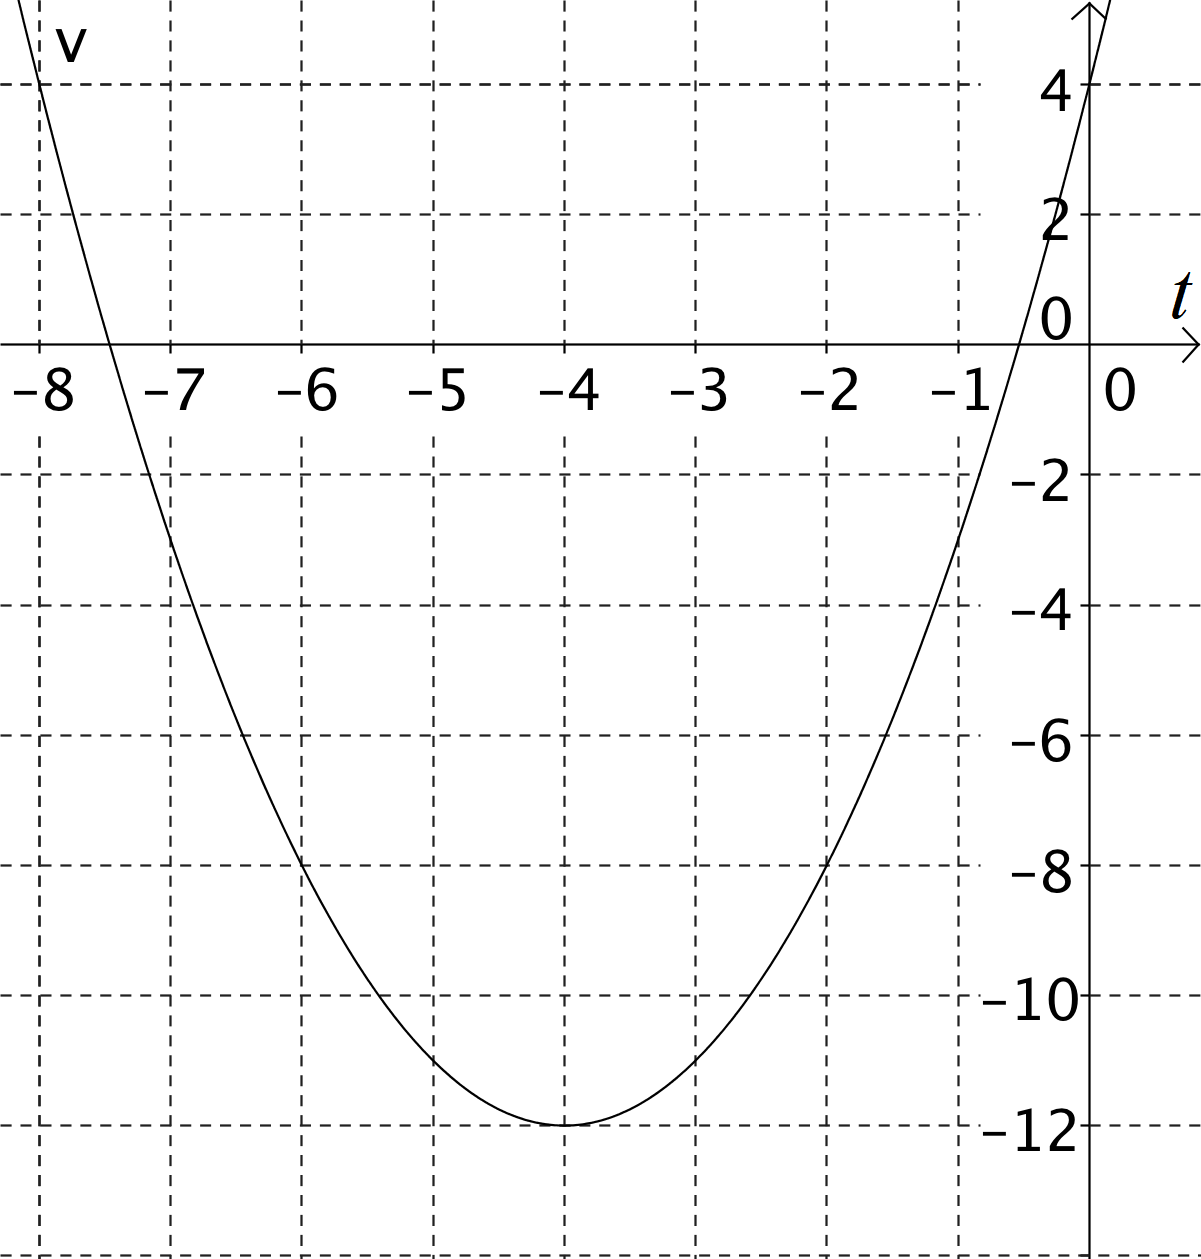
Figure 1.4.20. Graph of the function v(t).
What are the coordinates of the vertex of the graph of
\(v\text{?}\)
Write a function equation for
\(v(t)\text{.}\)
Solve the inequality
\(v(t) \geq -12\text{.}\)
What is the range of
\(v\) on the domain of all real numbers?
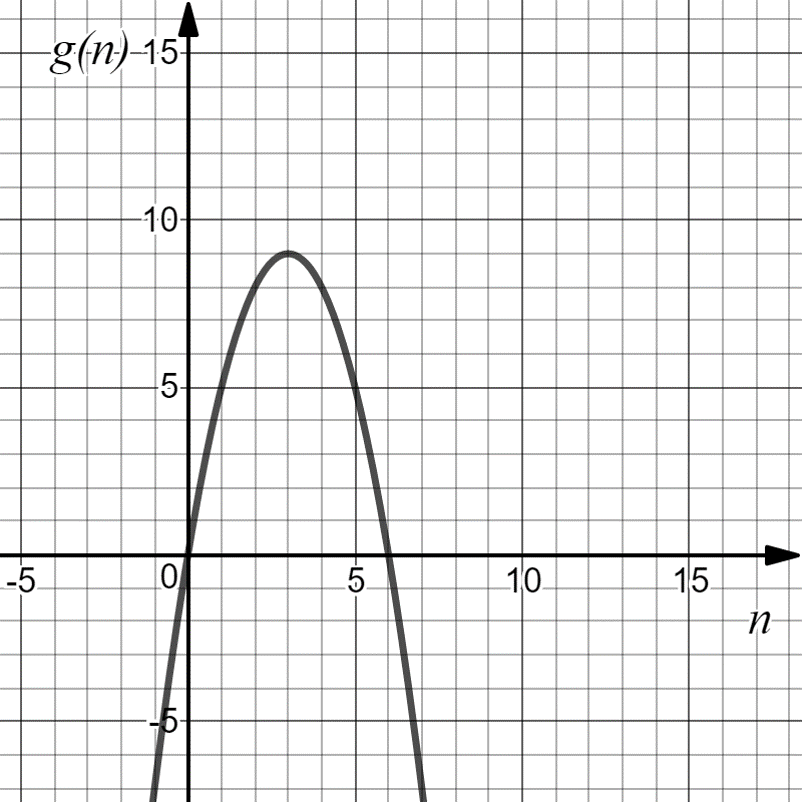
Refer to the graph of
\(g\) below.
Figure 1.4.21.
Evaluate
\(g(5)\text{.}\)
Write an equation for
\(g(n)\text{.}\)
Use your equation from
Item 9.c to evaluate
\(g(10)\text{.}\)
Use your equation from
Item 9.c to solve
\(g(n)=-8\text{.}\) Use Desmos to check your answer.
Use your equation from
Item 9.c to solve
\(g(n)<8\text{.}\)
Write
\(k(x)\) in vertex form.
Sketch the graph of
\(k(x)\text{.}\)
Write
\(q(x)\) in vertex form.
Sketch the graph of
\(q(x)\text{.}\)
Solve each inequality algebraically. Check your answers on Desmos.
\(\displaystyle x^2>x+2\)
\(\displaystyle x^2+9x+13 \geq -7\)
\(\displaystyle 4x^2+8 \leq 33\)
\(\displaystyle -x^2+6x <8\)
Graph the path traveled by a point described by the parametric equations
\(x(t)=3+4t\text{,}\) \(y(t)=8-2t\) on the domain
\(-2 \leq t \leq 5\text{.}\) Label the location of the point at
\(t=0\text{.}\)
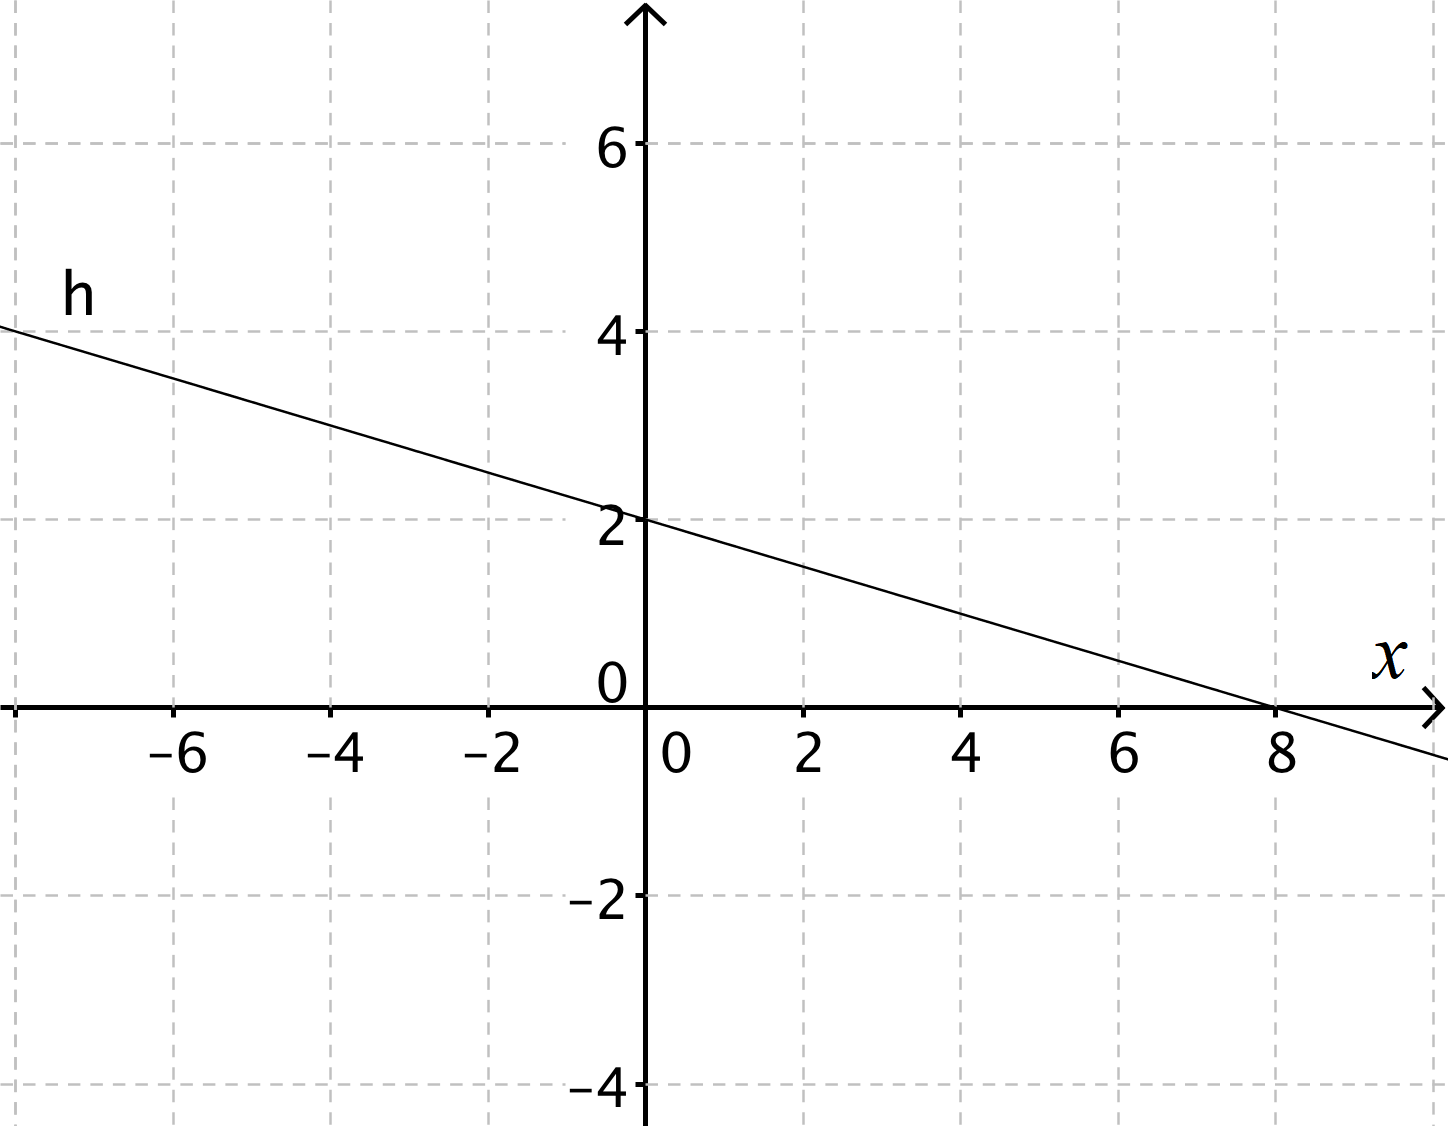
Refer to the graph of
\(h\) below.
Figure 1.4.22.
Write a function equation for
\(h(x)\text{.}\)
Use your function equation to evaluate
\(h(4)\text{.}\) Does this match with your answer from part
Item 14.a ?
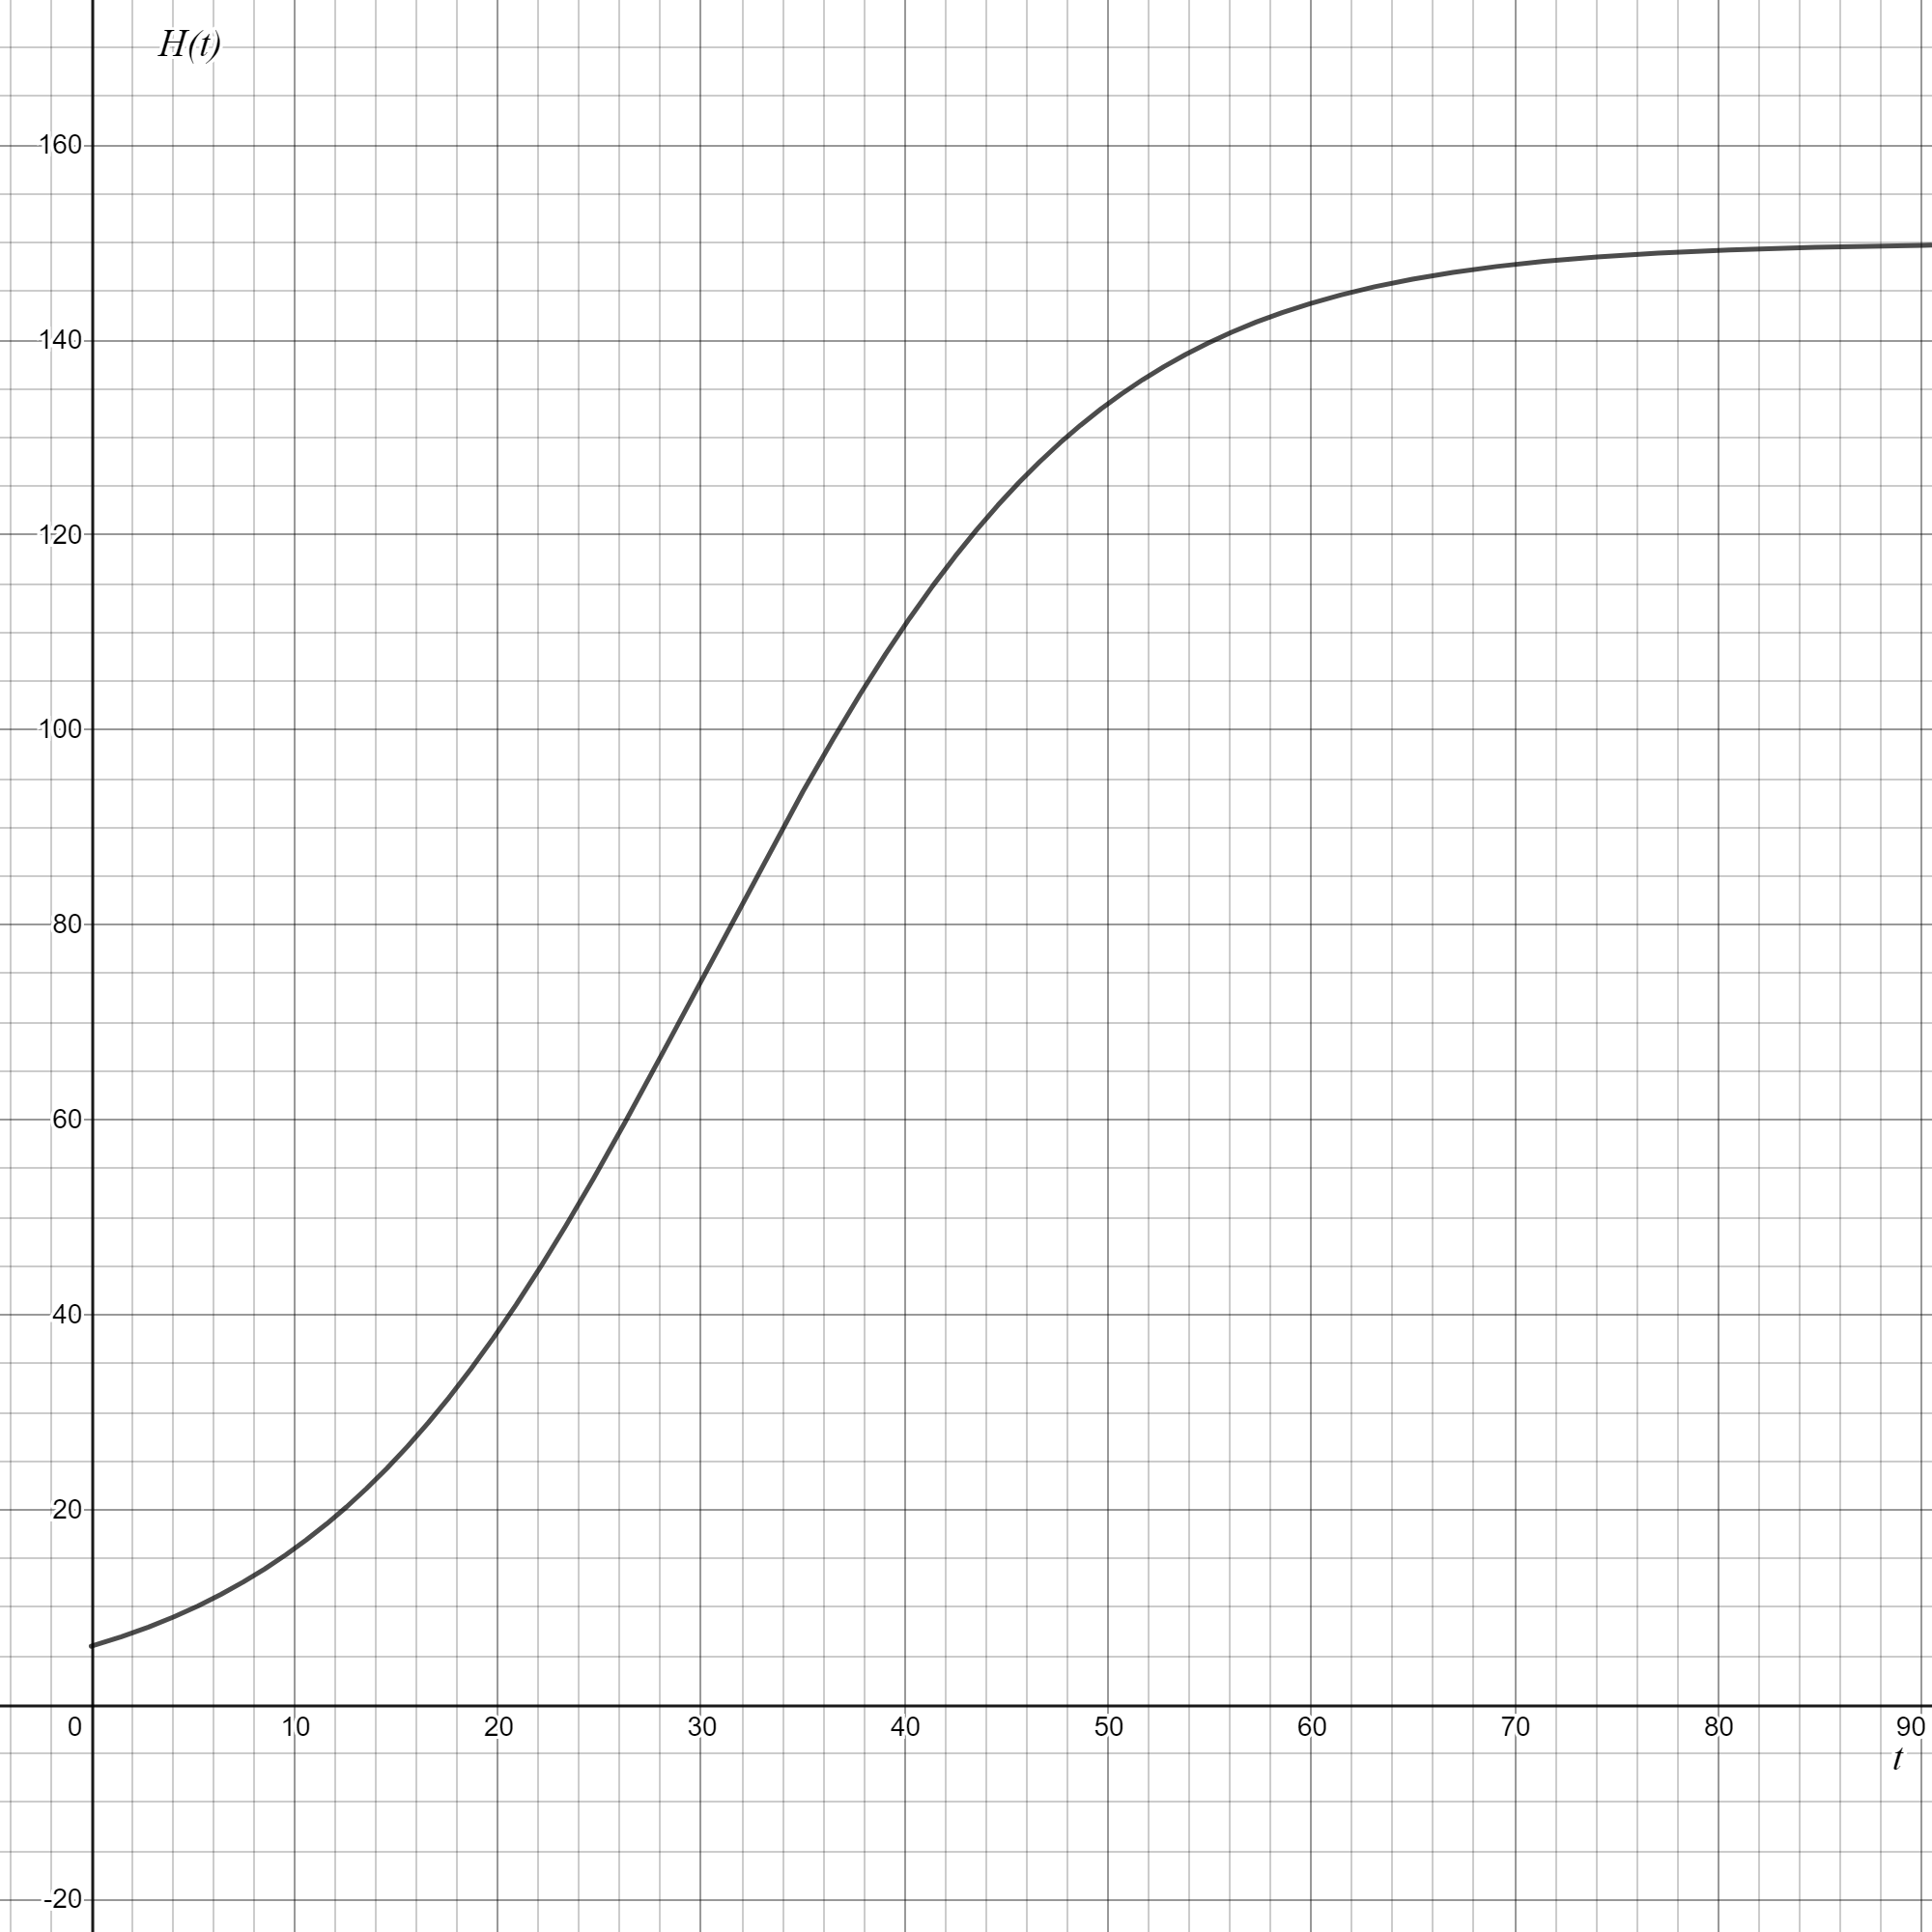
The graph below shows the height,
\(H\) (in cm), of a tomato plant
\(t\) days after it is planted outdoors.
Figure 1.4.23.
What is the height of the plant on the day it is planted outdoors?
How tall is the plant after 30 days?
How many days does it take for the plant to reach 80 cm?
Where is the height of the plant increasing the slowest? Where is the height of the plant increasing the fastest?